Qantas 2015 Annual Report Download - page 19
Download and view the complete annual report
Please find page 19 of the 2015 Qantas annual report below. You can navigate through the pages in the report by either clicking on the pages listed below, or by using the keyword search tool below to find specific information within the annual report.-
 1
1 -
2
-
3
-
4
-
5
-
6
-
7
-
8
-
 9
9 -
 10
10 -
 11
11 -
 12
12 -
 13
13 -
 14
14 -
 15
15 -
 16
16 -
 17
17 -
 18
18 -
 19
19 -
 20
20 -
 21
21 -
 22
22 -
 23
23 -
 24
24 -
 25
25 -
 26
26 -
 27
27 -
 28
28 -
 29
29 -
30
-
31
-
32
-
33
-
34
-
35
-
36
-
37
-
38
-
39
-
40
-
41
-
42
-
43
-
44
-
45
-
46
-
47
-
48
-
49
-
50
-
51
-
52
-
53
-
54
-
55
-
56
-
57
-
58
-
59
-
60
-
61
-
62
-
63
-
64
-
65
-
66
-
67
-
68
-
69
-
70
-
71
-
72
-
73
-
74
-
75
-
76
-
77
-
78
-
79
-
80
-
81
-
82
-
83
-
84
-
85
-
86
-
87
-
88
-
89
-
90
-
91
-
92
-
93
-
94
-
95
-
96
-
97
-
98
-
99
-
100
-
101
-
102
-
103
-
104
-
105
-
106
 |
 |

18
QANTAS ANNUAL REPORT 2015
QANTAS INTERNATIONAL
June
2015
June
2014
Change Change
%
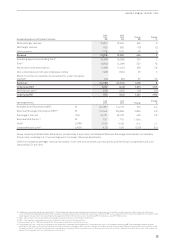
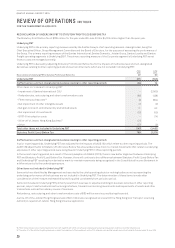
Total Revenue and Other Income42 $M 5,467 5,297 170 3
Revenue Seat Factor %81.5 79.6 1.9 pts
Underlying EBIT $M 267 (497) 764 >100
Qantas International saw a major improvement in recent periods with a $764 million turnaround in Underlying EBIT to $267 million in
2014/2015. The impressive result was led by the delivery of $408 million of cost and revenue benefits from the Qantas Transformation
program. Revenue increased three per cent on flat capacity, with a 1.9 percentage point improvement in Revenue Seat Factor,
reflecting stronger passenger loads on most routes. Revenue per ASK43 increased by six per cent. The segment result included a
$195 million reduction in depreciation expense from the non-cash fleet impairment to the Qantas International fleet taken in the
2013/2014 financial results.
Reflecting benefits from Qantas Transformation, comparable unit cost44 improved by four per cent in the year while aircraft utilisation
also improved by four per cent. Since 2011/2012, when the three-year turnaround plan for Qantas International began, aircraft
utilisation has increased by 15 per cent. One utilisation initiative in 2014/2015 involved the re-time of the Melbourne-London service
and the introduction of improved turnaround times for the A380, which combined, allowed one A380 hull to be released and deployed
on the Sydney-Dallas route. 2014/2015 also saw an increase in weekly services to Los Angeles and Santiago, the introduction of
seasonal flying to Vancouver, and the announcement that Perth-Singapore services would resume in early 2015/2016.
Qantas International has clear strategic priorities: reshaping our cost base through Transformation; owning the high-yield customer
in Australia; overcoming network gaps; and providing connections to the world. An enhanced partnership with American Airlines45
will facilitate closer commercial ties and growth between Australia and the US. Expanded alliances and code share relationships
with Westjet, Bangkok Airways and China Airlines all help improve network connectivity. Qantas International began the roll out of
reconfigured A330 aircraft on medium haul routes to Asia, including new ‘Business Suites’ with lie-flat beds. Average NPS improved
to a record41 level over the 12 months through targeted investment in lounges including Los Angeles Business and First in 2014/2015,
in-flight dining upgrades, and ongoing service training for our people.
JETSTAR GROUP
June
2015
June
2014
Change Change
%
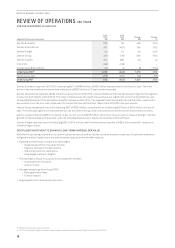
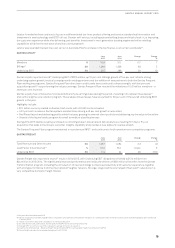
Total Revenue and Other Income $M 3,464 3,222 242 8
Revenue Seat Factor %79.9 7 7. 9 2 pts
Underlying EBIT $M 230 (116) 346 >10 0
Jetstar Group reported record Underlying EBIT of $230 million, a strong turnaround from a $116 million Underlying EBIT loss in the
prior year. The record performance reflected significant improvement across the Jetstar Group, with a continued focus on cost
transformation and revenue recovery. Controllable unit cost46 improved by two per cent47, while total revenue and other income rose
eight per cent reflecting higher yields and passenger loads as well as growth in ancillary revenue.
In domestic Australia, Jetstar benefits from closer dual-brand coordination with Qantas Domestic in stabilised market conditions.
Jetstar International delivered a record performance helped by the customer appeal and unit cost benefits of introducing the B787
on long haul international routes. Domestic New Zealand was profitable for Jetstar for the first time with ongoing RASK improvement
over the year.
All Jetstar Group airlines in Asia reported an improvement in earnings48, with combined losses halved compared to financial
2013/2014. Jetstar Asia (Singapore) returned to profit, Jetstar Pacific (Vietnam) was profitable in the second half of 2014/2015, and
Jetstar Japan reported a significant reduction in losses, with strong revenue per ASK improvement and ongoing controllable unit
cost46 reduction. The 2014/2015 financial accounts include a write-off of the Jetstar Hong Kong business of $21 million, following the
disappointing outcome of the Hong Kong Air Transport Licensing Authority’s rejection of Jetstar Hong Kong’s licence application. The
write-off was recognised outside of Underlying PBT.
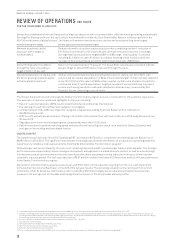
REVIEW OF OPERATIONS CONTINUED
FOR THE YEAR ENDED 30 JUNE 2015
42 Revenue includes six per cent passenger revenue per ASK growth and movements in other income including the impact of changes in block codeshare agreements
43 Revenue per ASK calculated as passenger revenue per ASK inclusive of Transformation benefits and foreign exchange movements
44 Comparable unit cost is calculated as Underlying EBIT less passenger revenue and fuel adjusted for the impact of the Qantas International fleet write-down, changes in discount rates,
changes in foreign exchange rates, changes in block codeshare agreements and movements in average sector length per ASK
45 Subject to regulatory approval
46 Controllable unit cost is calculated as Underlying expenses less fuel adjusted for the impact of Jetstar branded associates, changes in foreign exchange rates and movements in average
sector length per ASK
47 If adjusted for the impact of the carbon tax repeal, controllable unit cost improvement is one per cent
48 Based on Underlying EBIT