Qantas 2015 Annual Report Download - page 34
Download and view the complete annual report
Please find page 34 of the 2015 Qantas annual report below. You can navigate through the pages in the report by either clicking on the pages listed below, or by using the keyword search tool below to find specific information within the annual report.-
 1
1 -
2
-
3
-
4
-
5
-
6
-
7
-
8
-
9
-
10
-
11
-
12
-
13
-
14
-
15
-
16
-
17
-
18
-
19
-
20
-
21
-
22
-
23
-
 24
24 -
 25
25 -
 26
26 -
 27
27 -
 28
28 -
 29
29 -
 30
30 -
 31
31 -
 32
32 -
 33
33 -
 34
34 -
 35
35 -
 36
36 -
 37
37 -
 38
38 -
 39
39 -
 40
40 -
 41
41 -
 42
42 -
 43
43 -
 44
44 -
45
-
46
-
47
-
48
-
49
-
50
-
51
-
52
-
53
-
54
-
55
-
56
-
57
-
58
-
59
-
60
-
61
-
62
-
63
-
64
-
65
-
66
-
67
-
68
-
69
-
70
-
71
-
72
-
73
-
74
-
75
-
76
-
77
-
78
-
79
-
80
-
81
-
82
-
83
-
84
-
85
-
86
-
87
-
88
-
89
-
90
-
91
-
92
-
93
-
94
-
95
-
96
-
97
-
98
-
99
-
100
-
101
-
102
-
103
-
104
-
105
-
106
 |
 |

33
QANTAS ANNUAL REPORT 2015
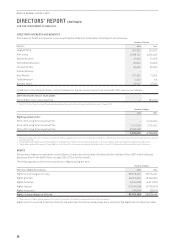
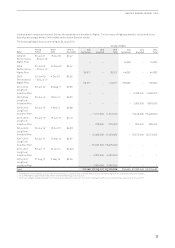
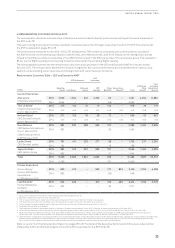
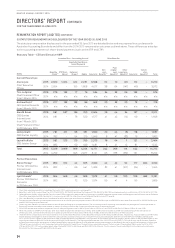
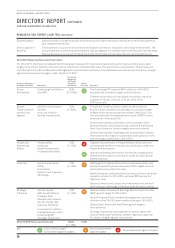
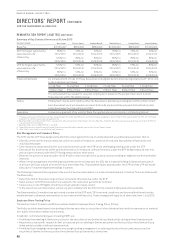
4) REMUNERATION OUTCOMES FOR 2014/2015
The remuneration decisions and outcomes at Qantas are clearly linked to Qantas’ performance via the performance measures in
theSTIP and LTIP.
This year’s strong financial performance resulted in outcomes above the ‘At Target’ level under the 2014/15 STIP. The result under
theSTIP is detailed on pages 35 to 36.
The performance measures for the 2013–2015 LTIP, being Qantas’ TSR relative to companies with ordinary shares included in
the ASX100 and an airline peer group (Global Listed Airlines), were tested as at 30 June 2015. Based on the vesting scale, Qantas
ranked in the 93rd percentile of companies in the ASX100 and ranked in the 60th percentile of the airline peer group. This resulted in
85percent of Rights vesting and converting to Qantas shares with the remaining Rights lapsing.
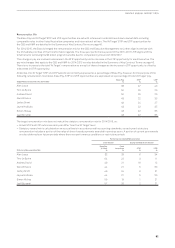
The following table summarises the remuneration decisions and outcomes for the CEO and Executive KMP for the year ended
30June2015. The remuneration detailed in this table is aligned to the current performance period and therefore is particularly
useful in understanding current year pay and its alignment with current year performance.
Remuneration Outcomes Table – CEO and Executive KMP1
STIP Outcomes3
LTIP
Outcomes4
$’000s
Base Pay
(Cash)2Cash Bonus
Deferred
Award
LTIP
Vesting5
Other
Benefits6
Termination
Benefit10 Total
LTIP Share
Price
Growth7
Total
Including
Share Price
Growth
Current Executives
Alan Joyce
Chief Executive Officer
2015
2014
2,000
2,054
1,904
–
952
–
2,353
–
112
(45)
–
–
7,321
2,009
4,563
–
11,88 4
–
Tino La Spina8
Chief Financial Officer
from 1 March 2015
2015
2014
279
n/a
152
n/a
76
n/a
19
n/a
152
n/a
–
n/a
678
n/a
36
n/a
714
n/a
Andrew David8
CEO Qantas Domestic
from 1 March 2015
2015
2014
277
n/a
152
n/a
76
n/a
29
n/a
72
n/a
–
n/a
606
n/a
57
n/a
663
n/a
Gareth Evans
CEO Qantas International
from 1 March 2015
Chief Financial Officer
to 28 February 2015
2015
2014
981
981
537
–
268
–
692
–
107
69
–
–
2,585
1,050
1,341
–
3,926
–
Lesley Grant
CEO Qantas Loyalty
2015
2014
781
782
411
–
205
–
277
–
58
16
–
–
1,732
798
537
–
2,269
–
Jayne Hrdlicka
CEO Jetstar Group
2015
2014
981
982
513
–
257
–
692
–
121
61
–
–
2,564
1,043
1,341
–
3,905
–
Total 2015
2014
5,299
4,799
3,669
–
1,834
–
4,062
–
622
101
–
–
15,486
4,900
7,875
–
23,361
–
Former Executives
Simon Hickey9
Former
CEO Qantas
International
to 28 February 2015
2015
2014
860
982
612
–
–
–
663
–
177
(34)
833
–
3,145
948
1,253
–
4,398
–
Lyell Strambi9
Former CEO Qantas
Domestic
to 28 February 2015
2015
2014
654
982
466
–
–
–
615
–
196
95
483
–
2,414
1,077
1,162
–
3,576
–
1 Detail of non-statutory remuneration methodology is explained on pages 36 and 37.
2 Base Pay (cash) paid to each Executive during the year.
3 The full value of STIP awards made to each Executive during each of the 2014/2015 and 2013/2014 financial years.
4 LTIP awards vested in 2014/2015 at 85 per cent. LTIP awards did not vest in 2013/2014, therefore nil value shown.
5 The face value of shares awarded based on the Qantas share price at the start of the performance period (1 July 2012).
6 Other Benefits are detailed on page 34.
7 The increase in the value of the share award from the start of the performance period (1 July 2012) to the end of the performance period (30 June 2015).
8 2014/2015 remuneration reflects the period of time in a key management role for Mr La Spina (1 March 2015 to 30 June 2015) and Mr David (1 March 2015 to 30 June 2015).
9 Mr Hickey ceased as a KMP on 28 February 2015 and ceased employment with Qantas on 15 May 2015 and Mr Strambi ceased as a KMP and ceased employment with Qantas on
28 February 2015. 2014/2015 remuneration is included up until the termination date of Mr Hickey of 15 May 2015 and for Mr Strambi of 28 February 2015.
10 Under the terms of separation, termination benefits of 10 months’ Base Pay and 6 months’ Base Pay were paid to Mr Hickey and Mr Strambi, respectively. As good leavers, both Mr Hickey
and Mr Strambi were eligible to receive deferred cash payments prorated for the portion of the performance period employed under the 2014/15 STIP and the Rights granted under
2013–2015 LTIP which lapsed on the termination date and were replaced by the deferred cash payments as disclosed in the table above.
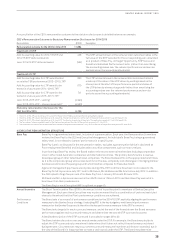
Refer to section 6 of the Remuneration Report on pages 35 to 37 for detail of the Executive Remuneration Structure, a description
of Base Pay, STIP and LTIP and analysis of the 2014/2015 outcomes for the STIP and LTIP.