Qantas 2015 Annual Report Download - page 14
Download and view the complete annual report
Please find page 14 of the 2015 Qantas annual report below. You can navigate through the pages in the report by either clicking on the pages listed below, or by using the keyword search tool below to find specific information within the annual report.-
 1
1 -
2
-
3
-
 4
4 -
 5
5 -
 6
6 -
 7
7 -
 8
8 -
 9
9 -
 10
10 -
 11
11 -
 12
12 -
 13
13 -
 14
14 -
 15
15 -
 16
16 -
 17
17 -
 18
18 -
 19
19 -
 20
20 -
 21
21 -
 22
22 -
 23
23 -
 24
24 -
25
-
26
-
27
-
28
-
29
-
30
-
31
-
32
-
33
-
34
-
35
-
36
-
37
-
38
-
39
-
40
-
41
-
42
-
43
-
44
-
45
-
46
-
47
-
48
-
49
-
50
-
51
-
52
-
53
-
54
-
55
-
56
-
57
-
58
-
59
-
60
-
61
-
62
-
63
-
64
-
65
-
66
-
67
-
68
-
69
-
70
-
71
-
72
-
73
-
74
-
75
-
76
-
77
-
78
-
79
-
80
-
81
-
82
-
83
-
84
-
85
-
86
-
87
-
88
-
89
-
90
-
91
-
92
-
93
-
94
-
95
-
96
-
97
-
98
-
99
-
100
-
101
-
102
-
103
-
104
-
105
-
106
 |
 |
13
QANTAS ANNUAL REPORT 2015
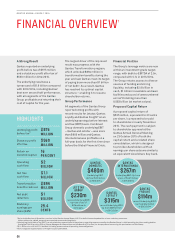
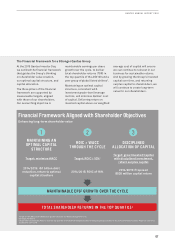
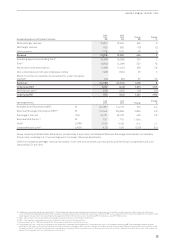
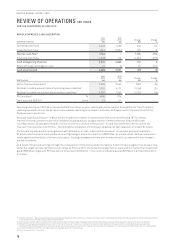
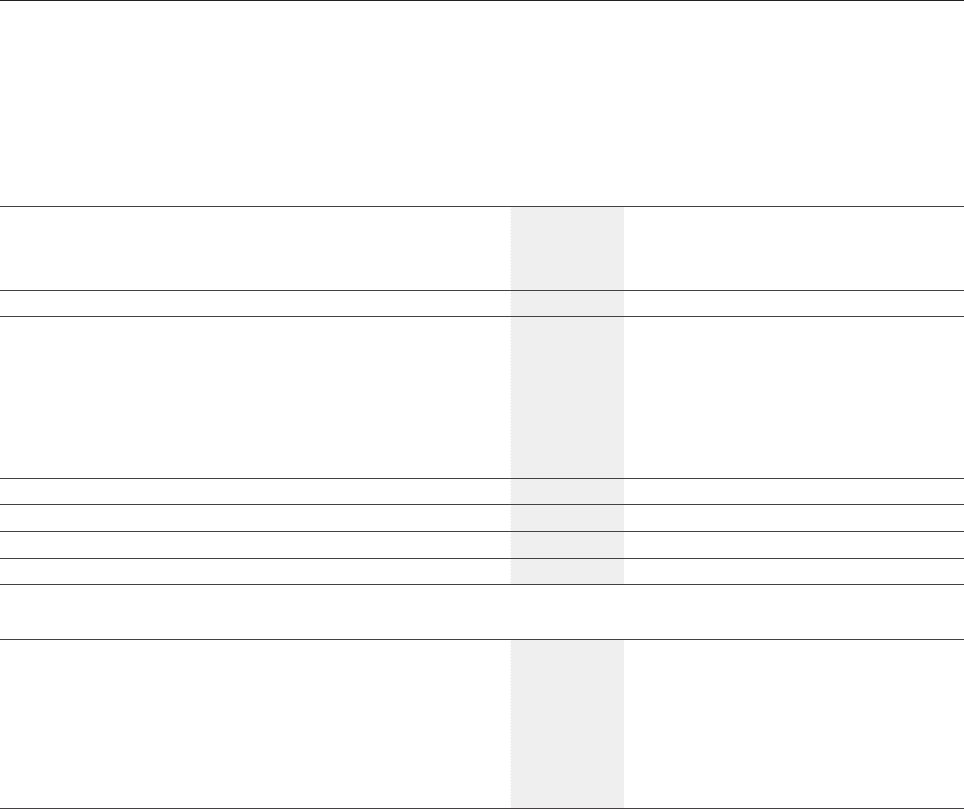
Group Underlying Income Statement Summary
June
2015
$M
June
2014
$M
Change
$M
Change
%
Net passenger revenue 13,667 13,242 425 3
Net freight revenue 936 955 (19) (2)
Other revenue 1,213 1,155 58 5
Revenue 15,816 15,352 464 3
Operating expenses (excluding fuel)16 (9,064) (9,288) 224 2
Fuel16 (3,899) (4,496) 597 13
Depreciation and amortisation (1,096) (1,422) 326 23
Non-cancellable aircraft operating lease rentals (495) (520) 25 5
Share of net loss of investments accounted for under the equity
method16 (29) (66) 37 56
Expenses (14,583) (15,792) 1,209 8
Underlying EBIT 1,233 (440) 1,673 >100
Net finance costs16 (258) (206) (52) (25)
Underlying PBT 975 (646) 1,621 >100
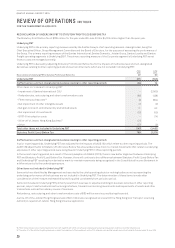
Operating Statistics
June
2015
June
2014 Change
Change
%
Available Seat Kilometres (ASK)17 M 142,287 141,715 572 0.4
Revenue Passenger Kilometres (RPK)18 M 112,5 4 3 109,659 2,884 2.6
Passengers Carried ‘000 49,181 48,776 405 0.8
Revenue Seat Factor 19 %79.1 77.4 1.7pts
Yield15 c/RPK 10.40 10.29 0.11 1.1
Comparable unit cost20 c/ASK 4.79 5.05 (0.26) (5.1)
Group capacity (Available Seat Kilometres) increased by 0.4 per cent, and demand (Revenue Passenger Kilometres) increased by
2.6 per cent, resulting in a 1.7 percentage point increase in Revenue Seat Factor.
Yield from ticketed passenger revenue increased 1.1 per cent on a constant currency basis, and the Group’s comparable unit cost
improved by 5.1 per cent.
16 Underlying operating expenses (excluding fuel) – total Underlying expenses excluding share of net loss of investments accounted for under the equity method, fuel and net finance
costs. These Underlying expenses differ from equivalent statutory expenses due to items excluded from Underlying PBT, such as adjustments for impacts of AASB 9 which relate to other
reporting periods and other items identified by Management. Refer to the reconciliation of Underlying PBT to Statutory (Loss)/Profit Before Tax
17 ASK – total number of seats available for passengers, multiplied by the number of kilometres flown
18 RPK – total number of passengers carried, multiplied by the number of kilometres flown
19 Revenue Seat Factor – RPKs divided by ASKs. Also known as seat factor, load factor or load
20 Comparable unit cost – unit cost is adjusted to aid comparability between reporting periods. Comparable unit cost is calculated as Underlying PBT less passenger revenue and fuel,
adjusted for the impact of the Qantas International fleet write-down, changes in discount rates, changes in foreign exchange rates, share of net loss of investments accounted for under
the equity method. If adjusted for movements in average sector length per ASK comparable unit cost improvement is 4.2 per cent and if adjusted further for the impact of the carbon tax
repeal, the comparable unit cost improvement is 2.6 per cent.