Qantas 2015 Annual Report Download - page 61
Download and view the complete annual report
Please find page 61 of the 2015 Qantas annual report below. You can navigate through the pages in the report by either clicking on the pages listed below, or by using the keyword search tool below to find specific information within the annual report.-
 1
1 -
2
-
3
-
4
-
5
-
6
-
7
-
8
-
9
-
10
-
11
-
12
-
13
-
14
-
15
-
16
-
17
-
18
-
19
-
20
-
21
-
22
-
23
-
24
-
25
-
26
-
27
-
28
-
29
-
30
-
31
-
32
-
33
-
34
-
35
-
36
-
37
-
38
-
39
-
40
-
41
-
42
-
43
-
44
-
45
-
46
-
47
-
48
-
49
-
50
-
 51
51 -
 52
52 -
 53
53 -
 54
54 -
 55
55 -
 56
56 -
 57
57 -
 58
58 -
 59
59 -
 60
60 -
 61
61 -
 62
62 -
 63
63 -
 64
64 -
 65
65 -
 66
66 -
 67
67 -
 68
68 -
 69
69 -
 70
70 -
 71
71 -
72
-
73
-
74
-
75
-
76
-
77
-
78
-
79
-
80
-
81
-
82
-
83
-
84
-
85
-
86
-
87
-
88
-
89
-
90
-
91
-
92
-
93
-
94
-
95
-
96
-
97
-
98
-
99
-
100
-
101
-
102
-
103
-
104
-
105
-
106
 |
 |

60
QANTAS ANNUAL REPORT 2015
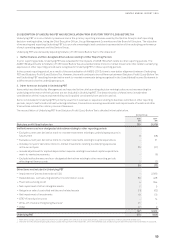
3. UNDERLYING PROFIT/(LOSS) BEFORE TAX,OPERATING SEGMENTS AND RETURN ON INVESTED CAPITAL CONTINUED
iii. Underlying EBIT
Underlying EBIT is calculated using a consistent methodology as outlined above but excluding the impact of statutory net finance
costs and ineffective and non-designated derivatives relating to other reporting periods affecting net finance costs.
(E) UNDERLYING PBT PER SHARE
Qantas Group
2015
cents
2014
cents
Basic/diluted Underlying PBT per share 44.4 (29.2)
Refer to Note 7 for the weighted average number of shares used in the calculation of basic/diluted Underlying PBT per share.
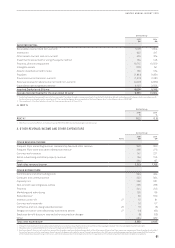
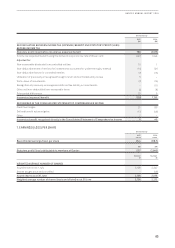
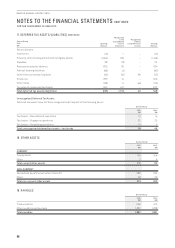
(F) ANALYSIS BY GEOGRAPHICAL AREAS
i. Revenue and Other Income by Geographic Areas
Qantas Group
Notes
2015
$M
2014
$M
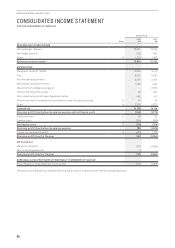
Net passenger and freight revenue
Australia 10,586 10,558
Overseas 4,017 3,639
Total net passenger and freight revenue 14,603 14,197
Other revenue/income 41,213 1,155
Total revenue and other income 15,816 15,352
Net passenger and freight revenue is attributed to a geographic region based on the point of sale and where not directly available, on
a pro-rata basis. Other revenue/income is not allocated to a geographic region as it is impractical to do so.
ii. Non-Current Assets by Geographic Areas
Non-current assets which consist principally of aircraft supporting the Group’s global operations are primarily located in Australia.
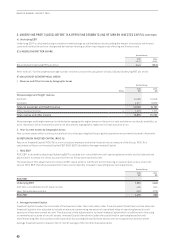
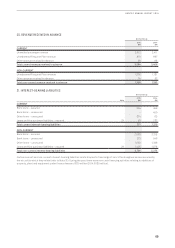
(G) RETURN ON INVESTED CAPITAL (ROIC %)
Return on Invested Capital (ROIC %) is a non-statutory measure and is the financial return measure of the Group. ROIC % is
calculated as Return on Invested Capital EBIT (ROIC EBIT) divided by Average Invested Capital.
i. ROIC EBIT
ROIC EBIT is derived by adjusting Underlying EBIT to exclude non-cancellable aircraft operating lease rentals and include notional
depreciation for these aircraft to account for them as if they were owned aircraft.
The objective of this adjustment is to show an EBIT result which is indifferent to the financing or ownership structure of aircraft
assets. ROIC EBIT therefore excludes the finance costs implicitly included in operating lease rental payments.
Qantas Group
2015
$M
2014
$M
ROIC EBIT
Underlying EBIT 1,233 (440)
Add: Non-cancellable aircraft lease rentals 495 520
Less: Notional depreciation (252) (273)
ROIC EBIT 1,476 (193)
ii. Average Invested Capital
Invested Capital includes the net assets of the business other than cash, debt, other financial assets/(liabilities) and tax balances.
Invested Capital is also adjusted to include an amount representing the external capitalised value of operating leased aircraft
assets as if they were owned aircraft. The objective of this adjustment is to show Invested Capital which is indifferent to financing
or ownership structures of aircraft assets. Invested Capital therefore includes the capital held in operating leased aircraft
notwithstanding that in accordance with Australian Accounting Standards these assets are not recognised on balance sheet.
Average Invested Capital is equal to the 12 month average of the monthly Invested Capital.