Qantas 2015 Annual Report Download - page 66
Download and view the complete annual report
Please find page 66 of the 2015 Qantas annual report below. You can navigate through the pages in the report by either clicking on the pages listed below, or by using the keyword search tool below to find specific information within the annual report.-
 1
1 -
2
-
3
-
4
-
5
-
6
-
7
-
8
-
9
-
10
-
11
-
12
-
13
-
14
-
15
-
16
-
17
-
18
-
19
-
20
-
21
-
22
-
23
-
24
-
25
-
26
-
27
-
28
-
29
-
30
-
31
-
32
-
33
-
34
-
35
-
36
-
37
-
38
-
39
-
40
-
41
-
42
-
43
-
44
-
45
-
46
-
47
-
48
-
49
-
50
-
51
-
52
-
53
-
54
-
55
-
 56
56 -
 57
57 -
 58
58 -
 59
59 -
 60
60 -
 61
61 -
 62
62 -
 63
63 -
 64
64 -
 65
65 -
 66
66 -
 67
67 -
 68
68 -
 69
69 -
 70
70 -
 71
71 -
 72
72 -
 73
73 -
 74
74 -
 75
75 -
 76
76 -
77
-
78
-
79
-
80
-
81
-
82
-
83
-
84
-
85
-
86
-
87
-
88
-
89
-
90
-
91
-
92
-
93
-
94
-
95
-
96
-
97
-
98
-
99
-
100
-
101
-
102
-
103
-
104
-
105
-
106
 |
 |

65
QANTAS ANNUAL REPORT 2015
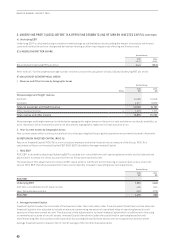
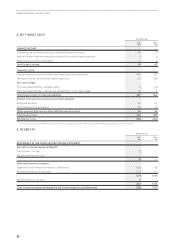
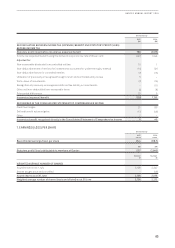
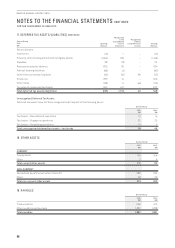
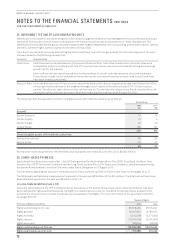
11. RECEIVABLES
Qantas Group
2015
$M
2014
$M
CURRENT
Trade debtors
Trade debtors 712 724
Provision for impairment losses (2) (3)
Total trade debtors 710 721
Sundry debtors 249 475
Total current receivables 959 1,196
NON-CURRENT
Sundry debtors 134 158
Total non-current receivables 134 158
The ageing of trade debtors, net of provision for impairment losses, at 30 June was:
Not past due 628 600
Past due 1–30 days 52 48
Past due 31–120 days 15 67
Past due 121 days or more 15 6
Total trade debtors 710 721
12. INVENTORIES
Qantas Group
2015
$M
2014
$M
Engineering expendables 270 245
Consumable stores 49 52
Work in progress 320
Total inventories 322 317
13. ASSETS CLASSIFIED AS HELD FOR SALE
Qantas Group
2015
$M
2014
$M
Assets
Property, plant and equipment 136 134
Total assets classified as held for sale 136 134
The non-recurring fair value measurement for property, plant and equipment classified as held for sale has been categorised under
the fair value hierarchy as Level 3 based on the inputs to the valuation technique used. Refer to Note 37 for a definition of the fair
value hierarchy.
The fair value less costs to sell for the individual assets was determined with reference to recent sale transactions.
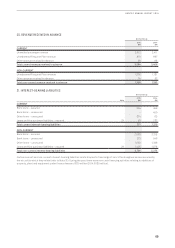
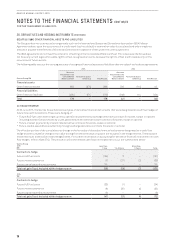
14. INVESTMENTS ACCOUNTED FOR UNDER THE EQUITY METHOD
Qantas Group
2015
$M
2014
$M
Carrying amount of investments accounted for under the equity method 134 143
Share of losses of investments accounted for under the equity method (40) (66)
Share of other comprehensive income 5 1