Qantas 2015 Annual Report Download - page 31
Download and view the complete annual report
Please find page 31 of the 2015 Qantas annual report below. You can navigate through the pages in the report by either clicking on the pages listed below, or by using the keyword search tool below to find specific information within the annual report.-
 1
1 -
2
-
3
-
4
-
5
-
6
-
7
-
8
-
9
-
10
-
11
-
12
-
13
-
14
-
15
-
16
-
17
-
18
-
19
-
20
-
 21
21 -
 22
22 -
 23
23 -
 24
24 -
 25
25 -
 26
26 -
 27
27 -
 28
28 -
 29
29 -
 30
30 -
 31
31 -
 32
32 -
 33
33 -
 34
34 -
 35
35 -
 36
36 -
 37
37 -
 38
38 -
 39
39 -
 40
40 -
 41
41 -
42
-
43
-
44
-
45
-
46
-
47
-
48
-
49
-
50
-
51
-
52
-
53
-
54
-
55
-
56
-
57
-
58
-
59
-
60
-
61
-
62
-
63
-
64
-
65
-
66
-
67
-
68
-
69
-
70
-
71
-
72
-
73
-
74
-
75
-
76
-
77
-
78
-
79
-
80
-
81
-
82
-
83
-
84
-
85
-
86
-
87
-
88
-
89
-
90
-
91
-
92
-
93
-
94
-
95
-
96
-
97
-
98
-
99
-
100
-
101
-
102
-
103
-
104
-
105
-
106
 |
 |

30
QANTAS ANNUAL REPORT 2015
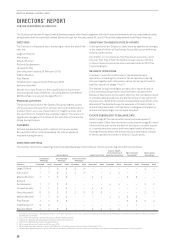
REMUNERATION REPORT (AUDITED) CONTINUED
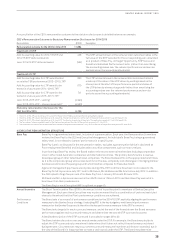
Changes to the Executive Remuneration Framework for 2014/2015
Changes to Pay Mix for 2014/2015
For 2014/2015 only, the pay mix for the CEO and Executive Management changed, with a decrease in weighting towards annual
incentive (STIP) and an increase in weighting towards long term incentive. These changes did not increase the total ‘At Target’ pay for
each Executive for 2014/2015, as each Executive’s LTIP opportunity was offset by a reduction in their annual incentive opportunity.
The pay-mix change for 2014/2015 further aligned Executive Management with the immediate priorities of the transformation agenda,
including the achievement of $2 billion in transformation benefits over the three years to 30 June 2017. The change was particularly
relevant for 2014/2015 as the timeframe for delivery of the $2 billion of transformation benefits is for the same three year period as
theperformance period for the LTIP awarded in 2014/2015 (2015–2017 LTIP). In the 2014 Remuneration Report, it was disclosed that
the change for 2014/2015 was a one-off only and therefore for 2015/2016 each Executive will revert to their original pay mix.
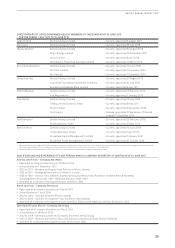
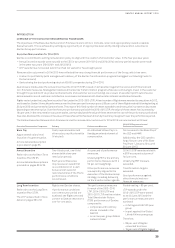
The pay mix for Executive Management is detailed on page 41. For the CEO, this change involves:
‘At Target’ opportunity 2013/2014 2014/2015 2015/2016
STIP ‘At Target’ opportunity expressed as a % of Base Pay 120 80 120
LTIP ‘At Target’ opportunity expressed as a % of Base Pay 80 120 80
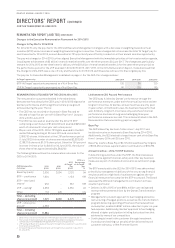
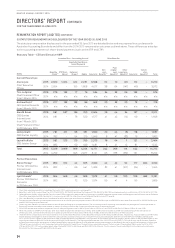
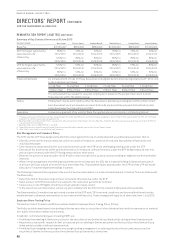
REMUNERATION OUTCOMES FOR THE CEO IN 2014/2015
The remuneration outcomes detailed in the table below
demonstrate how directly the CEO’s pay in 2014/2015 aligns with
Qantas’ performance and the significant share price growth
achieved during the year. That is:
–The CEO has not received an increase in Base Pay and he
elected to forgo five per cent of his Base Pay from 1 January
2014 until 30June 2015
–The CEO has received an award under the 2014/15 STIP
comprising a cash bonus of $1,904,000 and awarded $952,000
worth of shares with a two year restriction period
–85 per cent of the 2013–2015 LTIP Rights awarded to the CEO
vested following testing at 30 June 2015 and converted to
2,188,750 shares. At the start of the LTIP performance period
(1 July 2012) this number of shares was valued at $2,353,000
(2,188,750 shares at $1.075 share price). Given the 194 per cent
increase in share price (to $3.16 on 30 June 2015), the value of
these shares has appreciated by $4,563,000
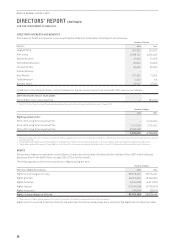
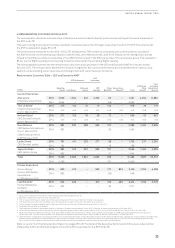
The following table outlines the remuneration outcomes for the
CEO for 2014/2015.
CEO Remuneration
Outcomes1
2015
$’000
2014
$’000
2015
‘At Target’
Pay
$’000
2015 as a
Percentage
of ‘At Target’
pay
%
Base Pay (cash) 2,000 2,054 2,125 94
STIP – cash bonus 1,904 –1,133 168
STIP – restricted
shares2952 –567 168
LTIP – vesting32,353 –2,550 92
Other 112 (45) –n/a
Total – excluding
share price growth 7,321 2,009 6,375 115
LTIP – share price
growth44,563
Total – including
share price growth 11,88 4
1 Detail of non-statutory remuneration methodology is explained on pages 36 and 37.
2 The number of restricted shares to be awarded will be determined based on the seven
calendar day Volume Weighted Average Share Price as at 27 August 2015.
3 LTIP vesting at 85 per cent valued at the start of the performance period (1 July 2012 when
the share price was $1.075).
4 Increase in the value of the vested shares over the performance period (1 July 2012 to
30 June 2015).
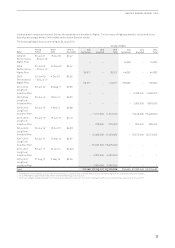
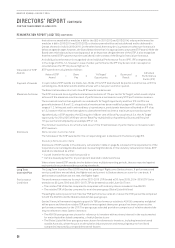
Link between CEO Pay and Performance
The CEO’s pay is linked to Qantas’ performance through the
performance measures under both the annual incentive and the
long term incentive. At Qantas, annual incentives are only paid
in years when, in the Board’s view, the business has performed
well. Similarly, long term incentives only vest where financial
performance has been strong and challenging three year
performance measures are met. This is demonstrated in the CEO
Remuneration Outcome History graph on page 31.
Base Pay
The CEO’s Base Pay has been frozen since 1 July 2011 and
he did not receive an increase to Base Pay during 2014/2015.
Additionally, the CEO elected to forgo five per cent of his Base Pay
from 1 January 2014 until 30 June 2015.
Base Pay (cash) is Base Pay of $2,125,000 less Base Pay forgone
of $106,250 and less superannuation contributions of $18,783.
Annual Incentive – 2014/15 STIP Outcome
In determining outcomes under the STIP, the Board assesses
performance against financial, safety and other key business
measures as part of a balanced scorecard, as outlined on page
38.
The STIP award paid to the CEO for 2014/2015 was determined
primarily by management’s delivery of the very strong financial
results as well as a high level of achievement against the non-
financial measures that comprise the STIP scorecard. The Board
assessed the CEO and management’s contribution to these
results in particular:
–Delivery in 2014/2015 of over $894 million cost savings and
revenue enhancements driven by the Qantas Transformation
program
–Management’s prudent approach to fuel hedging and active
restructuring of hedged positons, as well as the transformation
program delivering operating efficiencies that reduced fuel
consumption, enabled a $597 million reduction in year-on-year
fuel expense. Additionally, Qantas’ approach to fuel hedging
allowed a higher participation in falling fuel prices than that
achieved by many of our competitors
–Continuing to invest in the customer (through investment
in product and training our people), which delivered record
customer advocacy, or Net Promoter Scores
DIRECTORS’ REPORT CONTINUED
FOR THE YEAR ENDED 30 JUNE 2015