Qantas 2015 Annual Report Download - page 32
Download and view the complete annual report
Please find page 32 of the 2015 Qantas annual report below. You can navigate through the pages in the report by either clicking on the pages listed below, or by using the keyword search tool below to find specific information within the annual report.-
 1
1 -
2
-
3
-
4
-
5
-
6
-
7
-
8
-
9
-
10
-
11
-
12
-
13
-
14
-
15
-
16
-
17
-
18
-
19
-
20
-
21
-
 22
22 -
 23
23 -
 24
24 -
 25
25 -
 26
26 -
 27
27 -
 28
28 -
 29
29 -
 30
30 -
 31
31 -
 32
32 -
 33
33 -
 34
34 -
 35
35 -
 36
36 -
 37
37 -
 38
38 -
 39
39 -
 40
40 -
 41
41 -
 42
42 -
43
-
44
-
45
-
46
-
47
-
48
-
49
-
50
-
51
-
52
-
53
-
54
-
55
-
56
-
57
-
58
-
59
-
60
-
61
-
62
-
63
-
64
-
65
-
66
-
67
-
68
-
69
-
70
-
71
-
72
-
73
-
74
-
75
-
76
-
77
-
78
-
79
-
80
-
81
-
82
-
83
-
84
-
85
-
86
-
87
-
88
-
89
-
90
-
91
-
92
-
93
-
94
-
95
-
96
-
97
-
98
-
99
-
100
-
101
-
102
-
103
-
104
-
105
-
106
 |
 |

31
QANTAS ANNUAL REPORT 2015
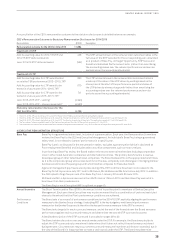
Based on the Board’s assessment of performance against the
STIP scorecard measures and the CEO’s individual performance,
the CEO’s STIP award was calculated as follows:
Total =Base Pay x
‘At Target’
Opportunity x
Scorecard
Result x
Individual
Performance
Factor
2,856,000 =2,125,000 x80% x140% x1.2
The CEO’s 2014/15 STIP award was paid two-thirds as a cash
bonus of $1,904,000 and one-third as deferred shares worth
$952,000 with a two year restriction period.
More detail on the 2014/15 STIP is provided on pages 35 to 36.
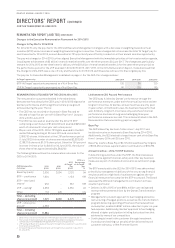
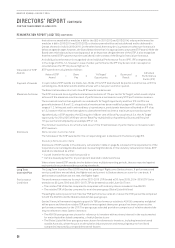
Long Term Incentive – 2013–2015 LTIP Outcome
At the 2012 Annual General Meeting (AGM), shareholders
approved an award of 2,575,000 Rights to the CEO under
the 2013–2015 LTIP. The vesting of these Rights was subject
to Qantas TSR performance compared to two peer groups
(companies with ordinary shares included in the ASX100 and an
airline peer group (Global Listed Airlines).
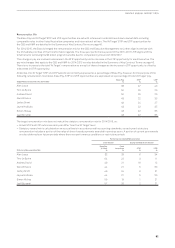
Over the three year performance period of the 2013–2015 LTIP,
the Qantas share price grew from $1.075 to $3.16, delivering a
total shareholder return of +194 per cent.
The following graph demonstrates Qantas TSR performance
versus the ASX100 and MSCI World Airline Indices over the
performance period of the 2013–2015 LTIP.
-50%
0%
50%
100%
150%
200%
250%
300%
QANTAS TSR PERFORMANCE v PEER GROUPS (%)
Qantas S&P / ASX 100 MSCI World Airlines
1July 2012 1July 2013 1July 2014 30 June 2015
This share price performance meant that Qantas ranked in
the 93rd percentile of companies in the ASX100 and ranked
in the 60th percentile of the airline peer group. Based on this
performance, 85 per cent of Rights vested and the CEO was
awarded 2,188,750 shares.
The face value of the vested shares based on the Qantas share
price at the start of the performance period was $2,353,000. The
value of these shares increased by $4,563,000 over the three
year performance period.
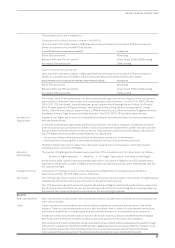
CEO Remuneration Outcomes History (2010/2011 to 2014/2015)
The Group’s incentive awards are designed to align Executive
remuneration with business performance. This is demonstrated
in the history of the incentive plan outcomes for the CEO.
CEO STIP LTIP Outcomes
2011
$552
2012
$95
2013
$186
2014
($646)
2015
$975
65% 38% 85%140%0% 0% 0% 0% 0% 0%
0%
20%
40%
60%
80%
100%
120%
140%
STIP LTIP STIP LTIP STIP LTIP STIP LTIP STIP LTIP
OUTCOME %
LTIP Vesting STIP Scorecard Outcome
Outcomes
Underlying
PBT ($m):
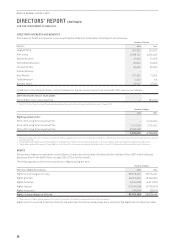
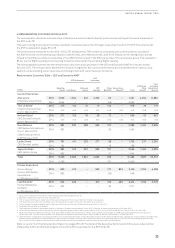
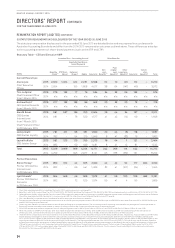
STATUTORY REMUNERATION DISCLOSURES FOR THE CEO
The statutory remuneration disclosures are prepared in
accordance with Australian Accounting Standards and differ
significantly from the outcomes for the CEO resulting from
performance in 2014/2015 outlined on page 30.
These differences arise due to the accounting treatment
of share-based payments (such as the STIP and LTIP).
A reconciliation of remuneration outcomes to statutory
remuneration disclosures is provided on page 35.
CEO Statutory
Remuneration Table
2015
$’000
2014
$’000
2015
‘At Target’ Pay
$’000
Base Pay (cash) 2,000 2,054 2,125
STIP – cash bonus 1,904 –1,133
STIP – share-based 423 155 567
LTIP 2,261 1,808 2,550
Other 112 (45) –
Total 6,700 3,972 6,375