Qantas 2015 Annual Report Download - page 7
Download and view the complete annual report
Please find page 7 of the 2015 Qantas annual report below. You can navigate through the pages in the report by either clicking on the pages listed below, or by using the keyword search tool below to find specific information within the annual report.-
 1
1 -
 2
2 -
 3
3 -
 4
4 -
 5
5 -
 6
6 -
 7
7 -
 8
8 -
 9
9 -
 10
10 -
 11
11 -
 12
12 -
 13
13 -
 14
14 -
 15
15 -
 16
16 -
 17
17 -
 18
18 -
19
-
20
-
21
-
22
-
23
-
24
-
25
-
26
-
27
-
28
-
29
-
30
-
31
-
32
-
33
-
34
-
35
-
36
-
37
-
38
-
39
-
40
-
41
-
42
-
43
-
44
-
45
-
46
-
47
-
48
-
49
-
50
-
51
-
52
-
53
-
54
-
55
-
56
-
57
-
58
-
59
-
60
-
61
-
62
-
63
-
64
-
65
-
66
-
67
-
68
-
69
-
70
-
71
-
72
-
73
-
74
-
75
-
76
-
77
-
78
-
79
-
80
-
81
-
82
-
83
-
84
-
85
-
86
-
87
-
88
-
89
-
90
-
91
-
92
-
93
-
94
-
95
-
96
-
97
-
98
-
99
-
100
-
101
-
102
-
103
-
104
-
105
-
106
 |
 |

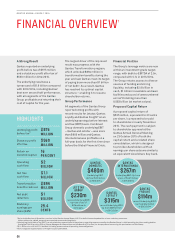
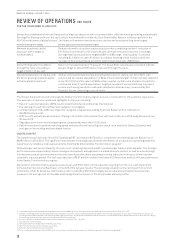
A Strong Result
Qantas reported an underlying
profit before tax of $975 million
and a statutory profit after tax of
$560 million for 2014/2015.
The underlying result was a
turnaround of $1.6 billion compared
with 2013/2014, including Qantas’
best ever second half performance,
with all segments of the Qantas
Group profitable and returning their
cost of capital for the year.
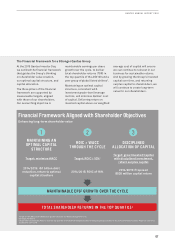
The largest driver of the improved
result was progress with the
Qantas Transformation program,
which unlocked $894 million in
transformation benefits during the
year and saw Qantas meet its target
of paying down more than $1billion
of net debt3. As a result, Qantas
has reached its optimal capital
structure – enabling it to resume
shareholder returns.
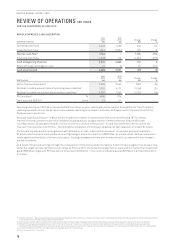
Group Performance
All segments of the Qantas Group
reported strong profits with
record results for Jetstar, Qantas
Loyalty and Qantas Freight4 on an
underlying earnings before interest
and tax (EBIT) basis. Combined
Group domestic underlying EBIT
– Qantas and Jetstar – was more
than $600million and Qantas
International was profitable on a
full-year basis for the first time since
before the Global Financial Crisis.
Financial Position
The Group’s leverage metrics are now
within an investment-grade target
range, with debt-to-EBITDA of 2.9x,
compared with 5.1x in 2013/2014.
The Group retains access to diverse
sources of funding and strong
liquidity, including $2.9 billion in
cash, $1 billion in available undrawn
facilities and a pool of unencumbered
aircraft totalling more than
US$3 billion (at market values).
Proposed Capital Return
A proposed capital return of
$505million, equivalent to 23 cents
per share, is proposed to be paid
to shareholders in early November
2015. The cash payment is subject
to shareholder approval at the
Qantas Annual General Meeting
on 23October 2015 of both the
capital return and a related share
consolidation, which is designed
to provide shareholders with an
earnings per share outcome similar to
an equivalent-sized share buy-back.
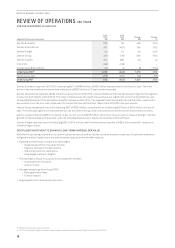
FINANCIAL OVERVIEW1
QANTAS
DOMESTIC
$480m
Underlying EBIT.
Up from $30 million
in 2013/2014
QANTAS
INTERNATIONAL
$267m
Underlying EBIT. Up from
a loss of $497 million
in 2013/2014
QANTAS
LOYALTY
$315m
record Underlying EBIT.
Up from $286 million
in 2013/2014
JETSTAR
GROUP
$230m
record Underlying EBIT.
Up from a loss of
$116 million in
2013/2014
QANTAS
FREIGHT
$114m
record Underlying EBIT4
.
Up from $24 million
in 2013/2014
1 Refer to the Review of Operations section in the Qantas Annual Report 2015 for definition and explanation of non-statutory measures.
Unless otherwise stated, amounts are reported on an underlying basis.
2 Underlying Profit Before Tax (PBT) is a non-statutory measure and is the primary reporting measure used by the Qantas Group’s chief operating decision-making bodies
(being the Chief Executive Officer, Group Management Committee and the Board of Directors) for the purpose of assessing the performance of the Group.
3 $1.1 billion since 2012/2013. Net debt including present value of operating lease obligations.
4 Since separate segmentation of Freight result in 2007/2008.
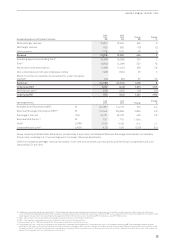
Underlying profit
before tax2
$975
MILLION
Statutory profit
after tax
$560
MILLION
Return on
invested capital
16
PER CENT
Operating
cash flow
$2
BILLION
Net free
cash flow
$1.1
BILLION
Transformation
benefits realised $894
MILLION
Net debt
reduction
$1
BILLION
Statutory
earnings per
share (EPS)
25.4
CENTS
HIGHLIGHTS
06
QANTAS ANNUAL REPORT 2015