Qantas 2015 Annual Report Download - page 74
Download and view the complete annual report
Please find page 74 of the 2015 Qantas annual report below. You can navigate through the pages in the report by either clicking on the pages listed below, or by using the keyword search tool below to find specific information within the annual report.-
 1
1 -
2
-
3
-
4
-
5
-
6
-
7
-
8
-
9
-
10
-
11
-
12
-
13
-
14
-
15
-
16
-
17
-
18
-
19
-
20
-
21
-
22
-
23
-
24
-
25
-
26
-
27
-
28
-
29
-
30
-
31
-
32
-
33
-
34
-
35
-
36
-
37
-
38
-
39
-
40
-
41
-
42
-
43
-
44
-
45
-
46
-
47
-
48
-
49
-
50
-
51
-
52
-
53
-
54
-
55
-
56
-
57
-
58
-
59
-
60
-
61
-
62
-
63
-
 64
64 -
 65
65 -
 66
66 -
 67
67 -
 68
68 -
 69
69 -
 70
70 -
 71
71 -
 72
72 -
 73
73 -
 74
74 -
 75
75 -
 76
76 -
 77
77 -
 78
78 -
 79
79 -
 80
80 -
 81
81 -
 82
82 -
 83
83 -
 84
84 -
85
-
86
-
87
-
88
-
89
-
90
-
91
-
92
-
93
-
94
-
95
-
96
-
97
-
98
-
99
-
100
-
101
-
102
-
103
-
104
-
105
-
106
 |
 |

73
QANTAS ANNUAL REPORT 2015
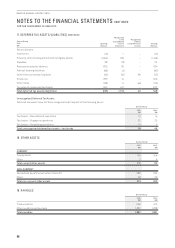
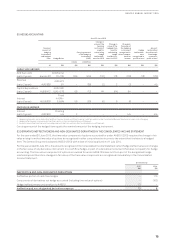
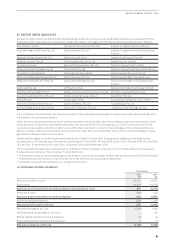
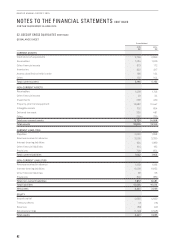
During the 2014/2015 year, 64,317,000 Rights were granted. No amount has been paid, or is payable, by the Executive in relation to
these Rights. Performance hurdles in relation to the outstanding Rights at 30 June 2015 were tested as at 30 June 2015. As a result,
1,740,150 Rights from the 2013–2015 LTIP award will lapse subsequent to 30 June 2015.
During the year, 58,844 Rights were exercised.
At 30 June 2015, 38,517 Rights are available to be exercised at the request of the Executive under the 2005/2006 award and a further
119,071 Rights under the 2006/2007 award (2014: 14,860 Rights under the 2004/2005 award, 44,682 Rights under 2005/2006 award
and 156,890 Rights under the 2006/2007 award).
Fair Value Calculation
The estimated value of Rights granted was determined at grant date using a Monte Carlo model.
The weighted average fair value of Rights granted during the year was $1.06 (2014: $0.83).
2015 2014
Inputs into the models
3 May
2015
24 October
2014
15 September
2014
18 October
2013
Rights granted 2,580,500 4,688,500 57,048,000 13,790,000
Weighted average share value $3.40 $1.43 $1.48 $1.43
Expected volatility 35% 35% 35% 35%
Dividend yield 3.7% 1.2% 1.2% 1.5%
Risk-free interest rate 2.0% 2.5% 2.5% 2.9%
The expected volatility was determined having regard to the historical volatility of Qantas shares and the implied volatility on
exchange traded options. The risk-free rate was the yield on an Australian Government Bond at the grant date matching the
remaining useful lives of the plans. The yield is converted into a continuously compounded rate in the model. The expected life
assumes immediate exercise after vesting.
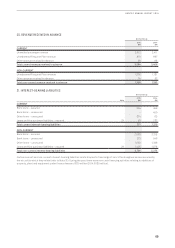
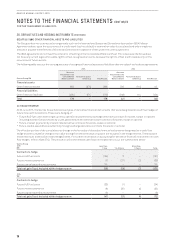
(B) SHORT TERM INCENTIVE PLAN (STIP)
For details on the operation of the STIP, see pages 35 to 36.
There were no awards of Qantas shares made under the STIP during the year ended 30 June 2015 (2014: 794,470 with a weighted
average share value of $1.36).
(C) MANAGER INCENTIVE PLAN (MIP)
The MIP is the annual incentive plan for the broader management group. Each year, to the extent that the plan’s performance
conditions are achieved, this group may receive an award that is a combination of cash and restricted shares. The MIP outcome is
based on individual performance (50 per cent) and scorecard performance (50 per cent). The scorecard performance outcomes are
the same as those for STIP. For scorecard performance outcomes, refer to the details of the operation of the STIP on pages 35 to 36.
There were no awards of Qantas shares made under the MIP during the year ended 30 June 2015 (2014: nil).
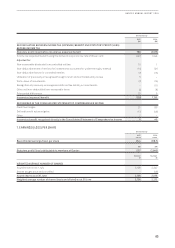
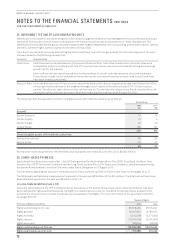
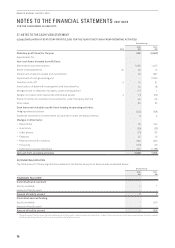
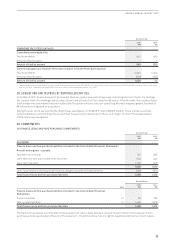
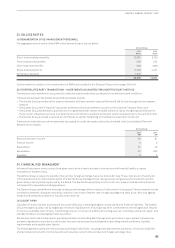
26. DERIVATIVES AND HEDGING INSTRUMENTS
The following section summarises derivative financial instruments in the Consolidated Income Statement, Consolidated Statement
of Comprehensive Income, Consolidated Balance Sheet and the Consolidated Statement of Changes in Equity.
(A) OTHER FINANCIAL ASSETS AND LIABILITIES
Qantas Group
2015
$M
2014
$M
NET OTHER FINANCIAL ASSETS/(LIABILITIES)
Derivatives
Designated as cash flow hedges1176 (98)
Designated as fair value hedges12(10)
De-designated derivatives –(7)
Not qualifying for hedge accounting (including time value of options) –73
Net other financial assets/(liabilities) 178 (42)
Net other financial assets/(liabilities) included in the Consolidated Balance Sheet
Other financial assets – current 613 172
Other financial assets – non-current 49 34
Other financial liabilities – current (416) (182)
Other financial liabilities – non-current (68) (66)
Net other financial assets/(liabilities) 178 (42)
1 Including time value of options after transition to AASB 9.