Qantas 2015 Annual Report Download - page 12
Download and view the complete annual report
Please find page 12 of the 2015 Qantas annual report below. You can navigate through the pages in the report by either clicking on the pages listed below, or by using the keyword search tool below to find specific information within the annual report.-
 1
1 -
 2
2 -
 3
3 -
 4
4 -
 5
5 -
 6
6 -
 7
7 -
 8
8 -
 9
9 -
 10
10 -
 11
11 -
 12
12 -
 13
13 -
 14
14 -
 15
15 -
 16
16 -
 17
17 -
 18
18 -
 19
19 -
 20
20 -
 21
21 -
 22
22 -
23
-
24
-
25
-
26
-
27
-
28
-
29
-
30
-
31
-
32
-
33
-
34
-
35
-
36
-
37
-
38
-
39
-
40
-
41
-
42
-
43
-
44
-
45
-
46
-
47
-
48
-
49
-
50
-
51
-
52
-
53
-
54
-
55
-
56
-
57
-
58
-
59
-
60
-
61
-
62
-
63
-
64
-
65
-
66
-
67
-
68
-
69
-
70
-
71
-
72
-
73
-
74
-
75
-
76
-
77
-
78
-
79
-
80
-
81
-
82
-
83
-
84
-
85
-
86
-
87
-
88
-
89
-
90
-
91
-
92
-
93
-
94
-
95
-
96
-
97
-
98
-
99
-
100
-
101
-
102
-
103
-
104
-
105
-
106
 |
 |

11
QANTAS ANNUAL REPORT 2015
REVIEW OF OPERATIONS
FOR THE YEAR ENDED 30 JUNE 2015
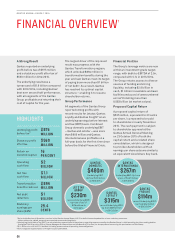
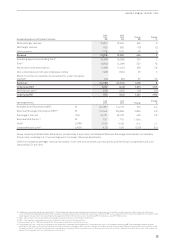
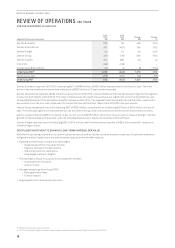
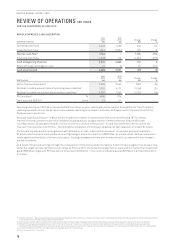
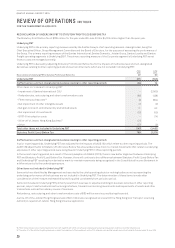
The Qantas Group reported an Underlying Profit Before Tax1 of $975 million for the 12 months ended 30 June 2015, an improvement
of over $1.6 billion from 2013/2014. The Group’s Statutory Profit After Tax of $560 million included $186 million of costs which
were not included in Underlying PBT1 primarily driven by redundancies, restructuring and other costs associated with the Qantas
Transformation program.
The Underlying PBT result is a strong turnaround from the 2013/2014 financial year, driven by cost and revenue benefits2 from
the Qantas Transformation program and a more favourable operating environment. Qantas continued to deliver on all of its major
strategic and operational commitments over the 2014/2015 financial year, resulting in the rapid recovery in earnings and return to
astrong balance sheet position.
The Qantas Transformation program was the major driver of the result delivering benefits of $894 million. Other drivers of the
resultincluded:
–Improved Revenue per ASK3
–Reduced fuel cost, benefiting from lower AUD fuel prices
–The positive impact of reduced depreciation expense resulting from the non-cash write down of Qantas International Fleet in
2013/2014 and the removal of the carbon tax
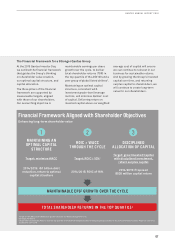
Qantas takes a disciplined approach to continually reviewing its optimal capital structure and, where there is surplus capital, to
assess how to enhance shareholder value with the appropriate mix of growth and shareholder returns. Having returned to our optimal
capital structure as at the end of 2014/2015, a $505 million capital return was declared.
The shareholder distribution is in the form of 23 cents per share capital return combined with a share consolidation. Subject to
shareholder approval of the capital return of $505 million at Qantas’ Annual General Meeting in October 2015, the 23 cents per share
payment will be made in November 2015.
Strategic highlights of the 2014/2015 financial year included:
–Qantas Transformation continuing to drive permanent shift in cost base and competitive position
–Disciplined capital allocation facilitated debt reduction and recommencement of shareholder returns
–Investment in product and innovation strengthened the Group’s leading market positions
–Focus on engaging our people and improving workplace culture
–Management of external volatility with robust hedging program, capacity and capital expenditure flexibility
All operating segments achieved Return on Invested Capital (ROIC)4 greater than the Group’s Weighted Average Cost of Capital
(WACC), contributing to Group ROIC of 16 per cent.
Qantas International Underlying EBIT1 of $267 million was a $764 million improvement from the prior year, driven by $408 million
of Transformation benefits realised in the year. Jetstar Group, Qantas Loyalty5 and Qantas Freight all achieved record Underlying
EBIT, while the combined Qantas Domestic and Qantas International Underlying EBIT result was the highest since financial year
2007/2008.
The $894 million of Qantas Transformation benefits realised during 2014/2015 was ahead of guidance of at least $675 million, with all
planned initiatives being delivered on or ahead of schedule. Transformation benefits included $576 million of non-fuel expenditure
reduction, $136 million from fuel efficiency6, and revenue benefits2 of $182 million from initiatives including increased utilisation7 of
international and domestic aircraft. Qantas transformation continues to drive a sustainable improvement in earnings.
1 Underlying Profit Before Tax (Underlying PBT) is the primary reporting measure used by the Qantas Group’s chief operating decision-making bodies, being the Chief Executive Officer,
Group Management Committee and the Board of Directors, for the purpose of assessing the performance of the Group. The primary reporting measure of the Qantas International, Qantas
Domestic, Jetstar Group, Qantas Loyalty and Qantas Freight operating segments is Underlying Earnings Before Net Finance Costs and Tax (Underlying EBIT). The primary reporting measure
of the Corporate segment is Underlying PBT as net finance costs are managed centrally. Refer to the reconciliation of Underlying PBT to Statutory Profit/(Loss) Before Tax
2 Any incremental costs associated with revenue benefits are netted in the overall cost benefits attributed to the Qantas Transformation program
3 Passenger Revenue per Available Seat Kilometre
4 Return on Invested Capital (ROIC) is a non-statutory measure and is the financial return measure of the Group. ROIC is calculated as Return on Invested Capital EBIT (ROIC EBIT) divided
by Average Invested Capital. ROIC EBIT is derived by adjusting Underlying EBIT to exclude non-cancellable aircraft operating lease rentals and include notional depreciation for these
aircraft to account for them as if they were owned aircraft. Invested Capital includes the net assets of the business other than cash, debt, other financial assets and liabilities, tax
balances and includes the capitalised value of operating leased aircraft assets. Average Invested Capital is equal to the 12 month average of the monthly Invested Capital
5 Qantas Loyalty record Underlying EBIT result compared to prior periods normalised for changes in accounting estimates of the fair value of points and breakage expectations effective
1January 2009.
6 Fuel efficiency includes reduction in consumption from fuel efficiency and reduction in into-plane costs following transformation initiatives
7 Aircraft utilisation is based on average block hours per aircraft