Qantas 2015 Annual Report Download - page 13
Download and view the complete annual report
Please find page 13 of the 2015 Qantas annual report below. You can navigate through the pages in the report by either clicking on the pages listed below, or by using the keyword search tool below to find specific information within the annual report.-
 1
1 -
2
-
 3
3 -
 4
4 -
 5
5 -
 6
6 -
 7
7 -
 8
8 -
 9
9 -
 10
10 -
 11
11 -
 12
12 -
 13
13 -
 14
14 -
 15
15 -
 16
16 -
 17
17 -
 18
18 -
 19
19 -
 20
20 -
 21
21 -
 22
22 -
 23
23 -
24
-
25
-
26
-
27
-
28
-
29
-
30
-
31
-
32
-
33
-
34
-
35
-
36
-
37
-
38
-
39
-
40
-
41
-
42
-
43
-
44
-
45
-
46
-
47
-
48
-
49
-
50
-
51
-
52
-
53
-
54
-
55
-
56
-
57
-
58
-
59
-
60
-
61
-
62
-
63
-
64
-
65
-
66
-
67
-
68
-
69
-
70
-
71
-
72
-
73
-
74
-
75
-
76
-
77
-
78
-
79
-
80
-
81
-
82
-
83
-
84
-
85
-
86
-
87
-
88
-
89
-
90
-
91
-
92
-
93
-
94
-
95
-
96
-
97
-
98
-
99
-
100
-
101
-
102
-
103
-
104
-
105
-
106
 |
 |

12
QANTAS ANNUAL REPORT 2015
REVIEW OF OPERATIONS CONTINUED
FOR THE YEAR ENDED 30 JUNE 2015
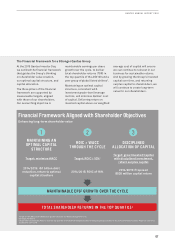
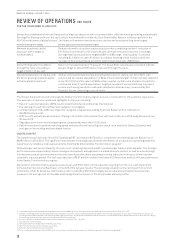
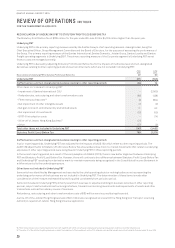
Qantas has established a financial framework to align our objectives with our shareholders. With the aim of generating maintainable
Earnings Per Share growth over the cycle, which in turn should translate into Total Shareholder Returns in the top quartile of the
ASX100 and a basket of global airlines8, the financial framework has three clear priorities and associated long-term targets:
Priorities and long-term targets Delivery against priorities and long-term targets
Maintain an optimal capital
structure, with a target to
minimiseWACC
Qantas returned to its optimal capital structure after completing net debt9 reduction of
$1.1billion since the 2012/2013 financial year. With the concurrent increase in earnings,
leverage metrics are within the targeted BBB- to BBB range. Total liquidity10 increased,
including $2.9 billion in cash, $1 billion in undrawn revolving credit facilities and a net
increase of 20 unencumbered aircraft to total market value over US$3 billion.
Deliver ROIC greater than WACC11
through the cycle, ensured by a
target of ROIC > 10 per cent
Return on Invested Capital of 16 percent. The Group ROIC outcome was consistent with the
Group’s target to deliver ROIC above 10 per cent through the cycle.
Disciplined allocation of capital, with
the aim of growing Invested Capital
with disciplined investment
Qantas continued to demonstrate disciplined allocation of capital over 2014/2015, with
constrained net capital expenditure12 of $944 million facilitating $1.1 billion net debt reduction
since 2012/2013 and the return of $505 million surplus capital to shareholders. Despite the
constrained level of capital expenditure, targeted investment across the Group in product,
service and training resulted in customer satisfaction and advocacy, measured by Net
Promoter Scores, improving to record levels.
The Group’s balanced scorecard through the Qantas Transformation program ensures a net benefit for the customer experience.
This was seen in customer and brand highlights for the year including:
–Record13 customer advocacy (NPS) results at Qantas Domestic and Qantas International
–The opening of new First and Business lounges in Los Angeles
–Commencement of the A330 reconfiguration program, progressively adding ‘Business Suites’ with lie-flat beds on
28A330familyaircraft
–B787 aircraft with enhanced customer offering in the Jetstar International fleet with two further aircraft already delivered since
30June 2015
–Ongoing customer service training programs completed by more than 10,000 staff
–Digital innovation focused on improving speed and ease of travel including auto check-in on mobile for Qantas Domestic and
next-gen online retailing and boarding at Jetstar
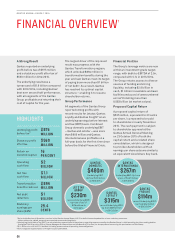
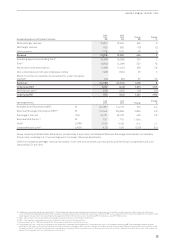
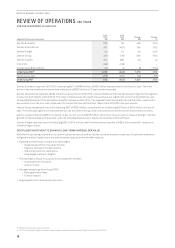
UNDERLYING PBT
The Qantas Group’s full-year 2014/2015 Underlying PBT increased to $975 million, compared to an Underlying Loss Before Tax of
$646 million in 2013/2014. The significant improvement in earnings was driven by the delivery of a reduction in operating expenses,
fuel efficiency initiatives, and revenue benefits from the $2 billion Qantas Transformation program14.
Net passenger revenue increased by three per cent, reflecting improved yields15 and passenger loads in most markets. This stronger
performance was supported by network changes and capacity management in a mixed domestic market, as well as a more benign
international competitive environment with the lower Australian dollar resulting in a steep reduction in the pace of international
competitor capacity growth. The fuel cost reduction of $597 million resulted from lower AUD fuel prices and fuel efficiency measures
in the Qantas Transformation program.
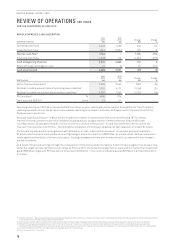
Depreciation and amortisation expenses were lower with $195 million of the reduction resulting from the non-cash impairment
to the Qantas International fleet taken in the 2013/2014 full year results. The remaining reduction is the net impact from aircraft
retirements offset by deliveries. Net finance costs increased by $52 million largely due to reduced capitalised interest and an
increase in the average cost of new debt and the significant extension of the Group’s debt maturity profile.
8 Compared to global airline peer group as stated in the Notice of Meeting for the 2014 Annual General Meeting, with reference to the 2015-2017 LTIP.
9 Net debt including present value of operating lease liabilities. The present value of operating lease liabilities for aircraft operating leases in accordance with AASB 117: Leases, are
not recognised on balance sheet. The operating lease liability has been calculated as the present value of future non-cancellable operating lease rentals of aircraft in service, using a
discount rate of seven per cent applied in Standard and Poor’s methodology
10 Includes cash and cash equivalents and $1 billion in undrawn facilities as at 7 July 2015
11 Calculated on a pre-tax basis
12 Net capital expenditure represents investing cash flows
13 Net Promoter Score (record achieved in June 2015)
14 $2 billion of gross benefits excluding inflation
15 Yield – passenger revenue divided by RPKs (both current year and prior year have been calculated using current foreign exchange rates)