Porsche 2008 Annual Report Download - page 225
Download and view the complete annual report
Please find page 225 of the 2008 Porsche annual report below. You can navigate through the pages in the report by either clicking on the pages listed below, or by using the keyword search tool below to find specific information within the annual report.-
 1
1 -
2
-
3
-
4
-
5
-
6
-
7
-
8
-
9
-
10
-
11
-
12
-
13
-
14
-
15
-
16
-
17
-
18
-
19
-
20
-
21
-
22
-
23
-
24
-
25
-
26
-
27
-
28
-
29
-
30
-
31
-
32
-
33
-
34
-
35
-
36
-
37
-
38
-
39
-
40
-
41
-
42
-
43
-
44
-
45
-
46
-
47
-
48
-
49
-
50
-
51
-
52
-
53
-
54
-
55
-
56
-
57
-
58
-
59
-
60
-
61
-
62
-
63
-
64
-
65
-
66
-
67
-
68
-
69
-
70
-
71
-
72
-
73
-
74
-
75
-
76
-
77
-
78
-
79
-
80
-
81
-
82
-
83
-
84
-
85
-
86
-
87
-
88
-
89
-
90
-
91
-
92
-
93
-
94
-
95
-
96
-
97
-
98
-
99
-
100
-
101
-
102
-
103
-
104
-
105
-
106
-
107
-
108
-
109
-
110
-
111
-
112
-
113
-
114
-
115
-
116
-
117
-
118
-
119
-
120
-
121
-
122
-
123
-
124
-
125
-
126
-
127
-
128
-
129
-
130
-
131
-
132
-
133
-
134
-
135
-
136
-
137
-
138
-
139
-
140
-
141
-
142
-
143
-
144
-
145
-
146
-
147
-
148
-
149
-
150
-
151
-
152
-
153
-
154
-
155
-
156
-
157
-
158
-
159
-
160
-
161
-
162
-
163
-
164
-
165
-
166
-
167
-
168
-
169
-
170
-
171
-
172
-
173
-
174
-
175
-
176
-
177
-
178
-
179
-
180
-
181
-
182
-
183
-
184
-
185
-
186
-
187
-
188
-
189
-
190
-
191
-
192
-
193
-
194
-
195
-
196
-
197
-
198
-
199
-
200
-
201
-
202
-
203
-
204
-
205
-
206
-
207
-
208
-
209
-
210
-
211
-
212
-
213
-
214
-
 215
215 -
 216
216 -
 217
217 -
 218
218 -
 219
219 -
 220
220 -
 221
221 -
 222
222 -
 223
223 -
 224
224 -
 225
225 -
 226
226 -
 227
227 -
 228
228 -
 229
229 -
 230
230 -
 231
231 -
 232
232 -
 233
233 -
 234
234 -
 235
235 -
236
-
237
-
238
-
239
-
240
-
241
-
242
-
243
-
244
-
245
-
246
-
247
-
248
-
249
-
250
-
251
-
252
-
253
-
254
 |
 |
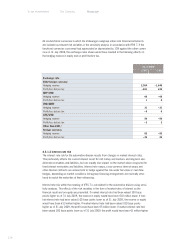
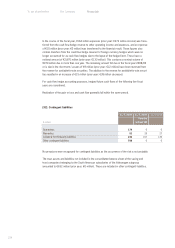
223
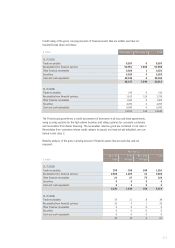
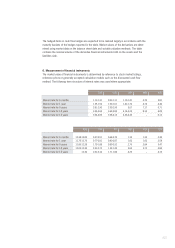
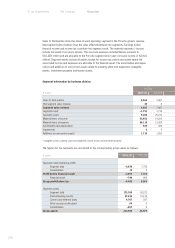
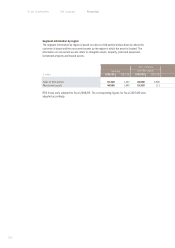
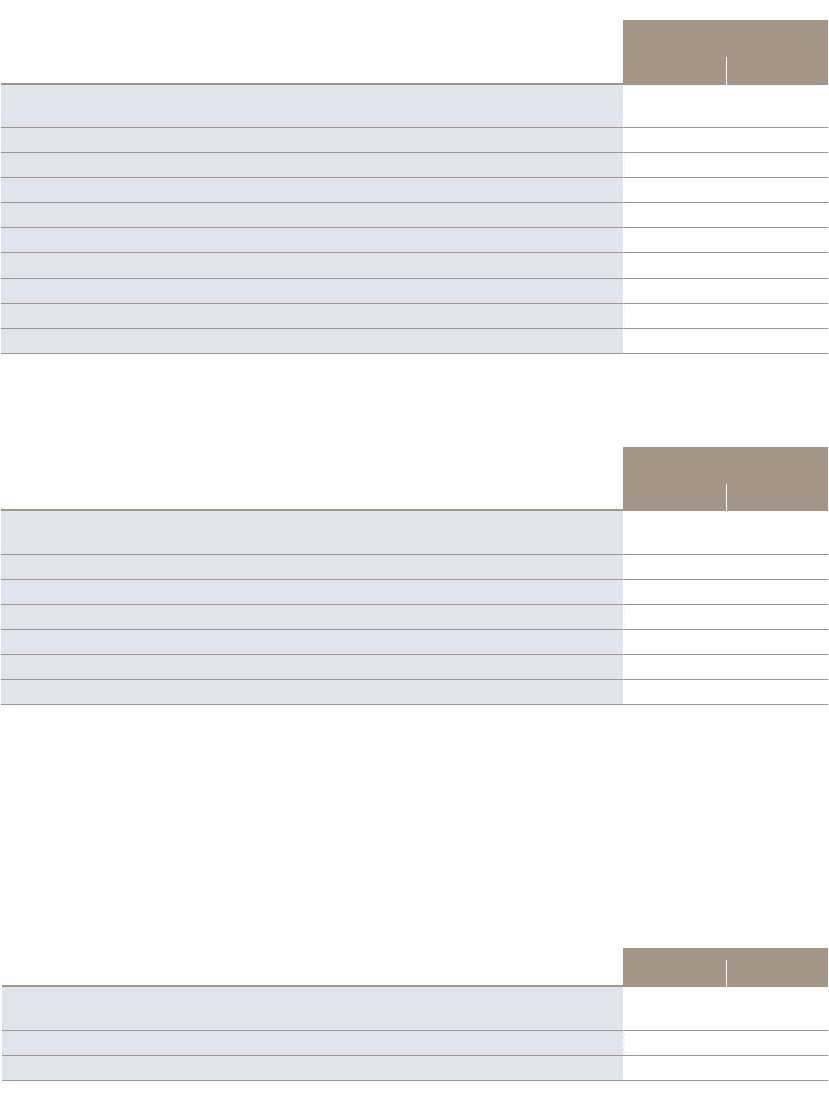
The carrying amounts are allocated to the respective measurement categories as follows:
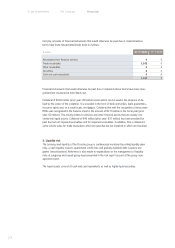
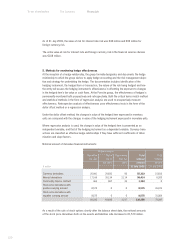
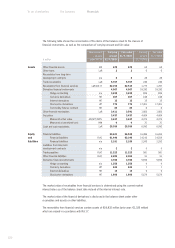
The net gains or losses of the respective measurement categories are as follows:
The net gains or losses from financial instruments in the measurement categories according to
IAS 39 are made up of interest, the fair value measurement of financial instruments, currency
translation gains or losses, impairments and gains on disposal. Interest also includes interest
income and expenses from the financial services division’s loans and leasing business. The finan-
cial instruments reported at fair value do not include dividend income.
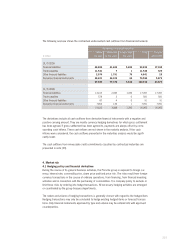
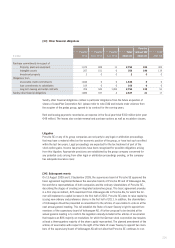
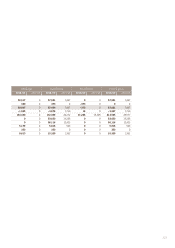
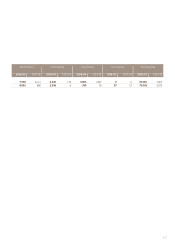
The following table shows gains and losses resulting from hedges.
The ineffective portion of cash flow hedges represents the income and expenses from changes in
the fair value of hedging instruments exceeding the change in fair value of hedged items, for which,
however, the effectiveness within the acceptable t range of 80% to 125% could be demonstrated.
Such income or expenses are recognized directly in other operating income and other operating
expenses.
Carrying amount
€ million 31/7/2009 31/7/2008
Financial assets at fair value through profit or loss 1,411 17,974
Designated upon initial recognition (FVtPL) 32 431
Held for trading (HfT) 1,379 17,543
Held to maturity investments (HtM) 031
Loans and receivables (LaR) 78,476 9,133
Available-for-sale financial assets (AfS) 4,043 3,967
Financial liabilities at fair value through profit or loss 2,530 5,692
Designated upon initial recognition (FVtPL) 00
Held for trading (HfT) 2,530 5,692
Financial liabilities measured at amortized cost (FLAC) 104,948 14,815
Net gains or losses
€ million 2008/09 2007/08
Financial instruments at fair value through profit or loss – 2,285 6,608
Designated upon initial recognition (FVtPL) – 57 1
Held for trading (HfT) – 2,228 6,607
Held to maturity investments (HtM) 12
Loans and receivables (LaR) 1,599 213
Available-for-sale financial assets (AfS) – 54 79
Financial liabilities measured at amortized cost (FLAC) – 2,595 – 360
€ million 2009 2008
Hedging instruments used in fair value hedges – 362 27
Hedged items used in fair value hedges 307 – 27
Ineffective portion of cash flow hedges 70