Porsche 2008 Annual Report Download - page 224
Download and view the complete annual report
Please find page 224 of the 2008 Porsche annual report below. You can navigate through the pages in the report by either clicking on the pages listed below, or by using the keyword search tool below to find specific information within the annual report.-
 1
1 -
2
-
3
-
4
-
5
-
6
-
7
-
8
-
9
-
10
-
11
-
12
-
13
-
14
-
15
-
16
-
17
-
18
-
19
-
20
-
21
-
22
-
23
-
24
-
25
-
26
-
27
-
28
-
29
-
30
-
31
-
32
-
33
-
34
-
35
-
36
-
37
-
38
-
39
-
40
-
41
-
42
-
43
-
44
-
45
-
46
-
47
-
48
-
49
-
50
-
51
-
52
-
53
-
54
-
55
-
56
-
57
-
58
-
59
-
60
-
61
-
62
-
63
-
64
-
65
-
66
-
67
-
68
-
69
-
70
-
71
-
72
-
73
-
74
-
75
-
76
-
77
-
78
-
79
-
80
-
81
-
82
-
83
-
84
-
85
-
86
-
87
-
88
-
89
-
90
-
91
-
92
-
93
-
94
-
95
-
96
-
97
-
98
-
99
-
100
-
101
-
102
-
103
-
104
-
105
-
106
-
107
-
108
-
109
-
110
-
111
-
112
-
113
-
114
-
115
-
116
-
117
-
118
-
119
-
120
-
121
-
122
-
123
-
124
-
125
-
126
-
127
-
128
-
129
-
130
-
131
-
132
-
133
-
134
-
135
-
136
-
137
-
138
-
139
-
140
-
141
-
142
-
143
-
144
-
145
-
146
-
147
-
148
-
149
-
150
-
151
-
152
-
153
-
154
-
155
-
156
-
157
-
158
-
159
-
160
-
161
-
162
-
163
-
164
-
165
-
166
-
167
-
168
-
169
-
170
-
171
-
172
-
173
-
174
-
175
-
176
-
177
-
178
-
179
-
180
-
181
-
182
-
183
-
184
-
185
-
186
-
187
-
188
-
189
-
190
-
191
-
192
-
193
-
194
-
195
-
196
-
197
-
198
-
199
-
200
-
201
-
202
-
203
-
204
-
205
-
206
-
207
-
208
-
209
-
210
-
211
-
212
-
213
-
 214
214 -
 215
215 -
 216
216 -
 217
217 -
 218
218 -
 219
219 -
 220
220 -
 221
221 -
 222
222 -
 223
223 -
 224
224 -
 225
225 -
 226
226 -
 227
227 -
 228
228 -
 229
229 -
 230
230 -
 231
231 -
 232
232 -
 233
233 -
 234
234 -
235
-
236
-
237
-
238
-
239
-
240
-
241
-
242
-
243
-
244
-
245
-
246
-
247
-
248
-
249
-
250
-
251
-
252
-
253
-
254
 |
 |
To our shareholders The Company
222
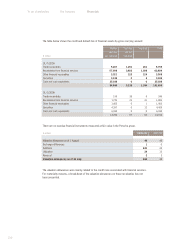
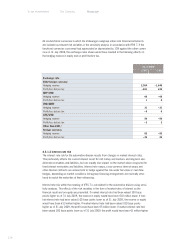
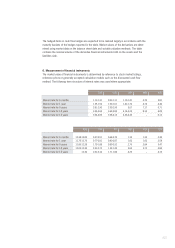
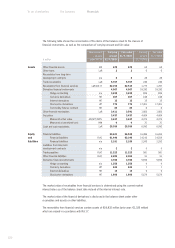
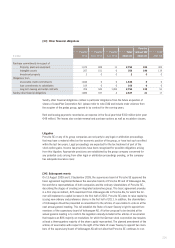
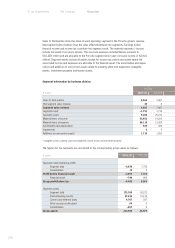
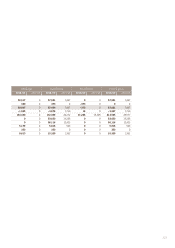
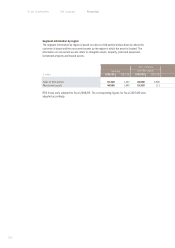
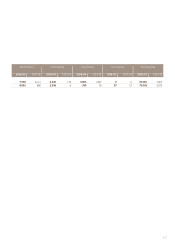
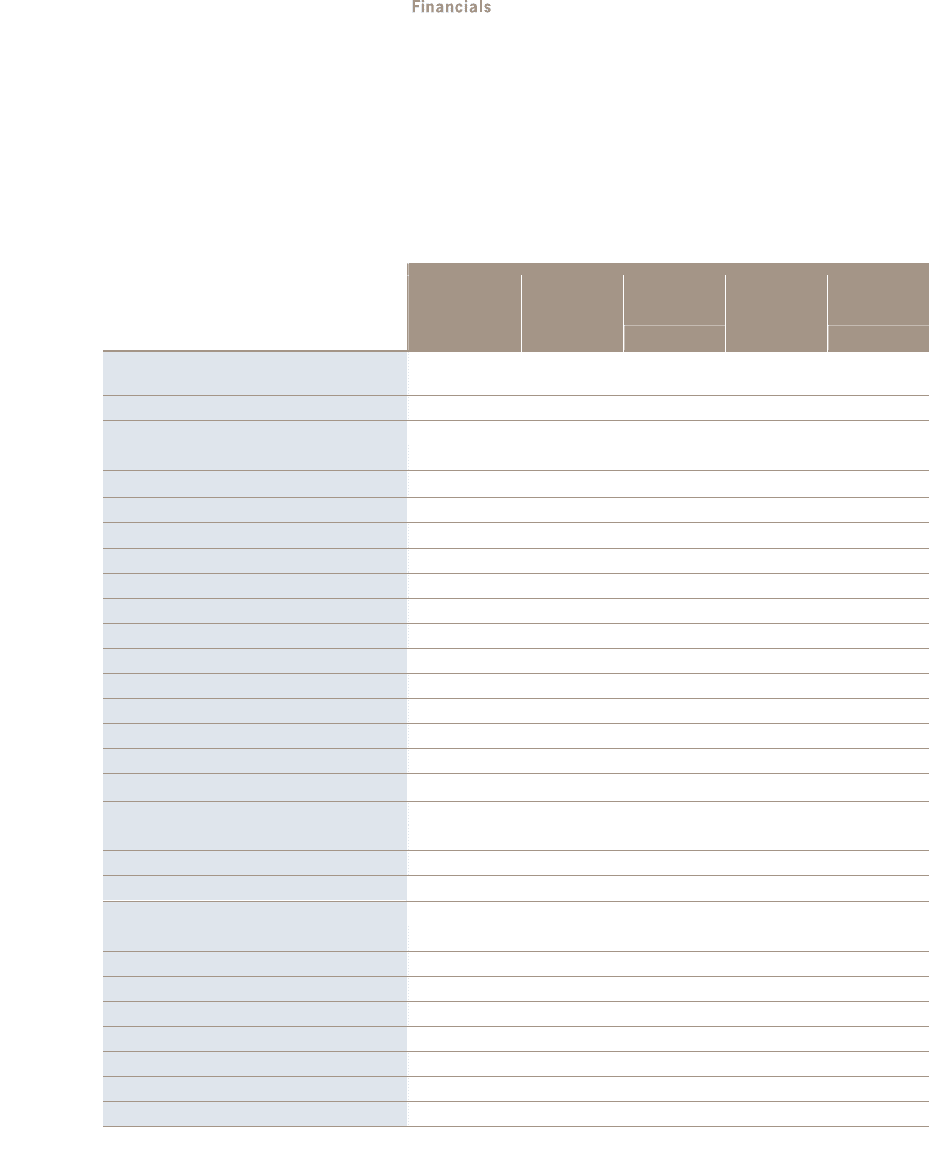
The following table shows the reconciliation of the items of the balance sheet to the classes of
financial instruments, as well as the comparison of carrying amount and fair value:
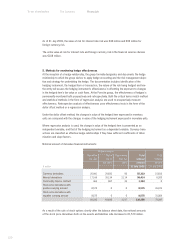
The market value of receivables from financial services is determined using the current market
interest rates as of the balance sheet date instead of the internal interest rate.
The market value of the financial derivatives is disclosed in the balance sheet under other
receivables and assets or other liabilities.
The receivables from financial services contain assets of €18,832 million (prior year: €1,326 million)
which are valued in accordance with IAS 17.
€ million
Measurement
category
under IAS 39
Carrying
amount
31/7/2009
Fair value
31/7/2009
Carrying
amount
31/7/2008
Fair value
31/7/2008
Assets Other financial assets AfS 678 678 64 64
Other loans LaR 22 0 0
Receivables from long-term
development contracts n/a 88 28 28
Trade receivables LaR 6,707 6,707 240 240
Receivables from financial services LaR/IAS 17 62,152 62,510 1,773 1,787
Derivative financial instruments 4,567 4,567 18,330 18,330
Hedge accounting n/a 3,228 3,228 826 826
Currency derivatives HfT 467 467 188 188
Interest derivatives HfT 15 15 15 15
Stock price derivatives HfT 774 774 17,301 17,301
Commodity futures contract HfT 83 83 0 0
Other financial receivables LaR 3,411 3,541 1,456 1,456
Securities 3,437 3,437 4,404 4,404
Measured at fair value AfS/HfT/FVtPL 3,437 3,437 4,373 4,373
Measured at amortized cost HtM 00 31 31
Cash and cash equivalents LaR 25,036 25,036 6,990 6,990
Equity Financial liabilities 93,621 94,528 16,386 16,269
and Financial liabilities FLAC 91,440 92,343 14,143 14,019
liabilities Financial liabilities n/a 2,181 2,185 2,243 2,250
Liabilities from long-term
development contracts n/a 22 5 5
Trade payables FLAC 11,223 11,223 581 581
Other financial liabilities FLAC 2,285 2,363 91 91
Derivative financial instruments 3,788 3,788 5,696 5,696
Hedge accounting n/a 1,258 1,258 4 4
Currency derivatives HfT 624 624 7 7
Interest derivatives HfT 13 13 6 6
Stock price derivatives HfT 1,893 1,893 5,679 5,679