Memorex 2014 Annual Report Download - page 80
Download and view the complete annual report
Please find page 80 of the 2014 Memorex annual report below. You can navigate through the pages in the report by either clicking on the pages listed below, or by using the keyword search tool below to find specific information within the annual report.
75
In 2014, 2013 and 2012 the net cash paid for income taxes, relating to both continuing and discontinued
operations, was $4.7 million, $4.6 million and $4.4 million, respectively.
Tax laws require certain items to be included in our tax returns at different times than the items are reflected in
our results of operations. Some of these items are temporary differences that will reverse over time. We record the
tax effect of temporary differences as deferred tax assets and deferred tax liabilities in our Consolidated Balance
Sheets.
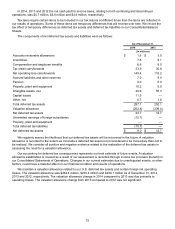
The components of net deferred tax assets and liabilities were as follows:
As of December 31,
2014 2013
(In millions)
Accounts receivable allowances $ 1.6 $ 3.0
Inventories 7.6 9.1
Compensation and employee benefits 6.6 8.0
Tax credit carryforwards 33.9 35.8
Net operating loss carryforwards 149.4 115.2
Accrued liabilities and other reserves 7.0 9.0
Pension 9.0 6.0
Property, plant and equipment 10.2 8.9
Intangible assets, net 49.6 55.3
Capital losses 11.5 —
Other, net 0.7 1.8
Total deferred tax assets 287.1 252.1
Valuation allowance (262.4) (239.4)
Net deferred tax assets 24.7 12.7
Unremitted earnings of foreign subsidiaries (15.7) —
Property, plant and equipment — —
Total deferred tax liabilities (15.7) —
Net deferred tax assets $ 9.0 $ 12.7
We regularly assess the likelihood that our deferred tax assets will be recovered in the future. A valuation
allowance is recorded to the extent we conclude a deferred tax asset is not considered to be more-likely-than-not to
be realized. We consider all positive and negative evidence related to the realization of the deferred tax assets in
assessing the need for a valuation allowance.
Our accounting for deferred tax consequences represents our best estimate of future events. A valuation
allowance established or revised as a result of our assessment is recorded through income tax provision (benefit) in
our Consolidated Statements of Operations. Changes in our current estimates due to unanticipated events, or other
factors, could have a material effect on our financial condition and results of operations.
We maintain a valuation allowance related to our U.S. deferred tax assets and certain foreign net operating
losses. The valuation allowance was $262.4 million, $239.4 million and $239.1 million as of December 31, 2014,
2013 and 2012, respectively. The valuation allowance change in 2014 compared to 2013 was due primarily to
operating losses. The valuation allowance change from 2013 compared to 2012 was not significant.


