Memorex 2014 Annual Report Download - page 70
Download and view the complete annual report
Please find page 70 of the 2014 Memorex annual report below. You can navigate through the pages in the report by either clicking on the pages listed below, or by using the keyword search tool below to find specific information within the annual report.-
 1
1 -
2
-
3
-
4
-
5
-
6
-
7
-
8
-
9
-
10
-
11
-
12
-
13
-
14
-
15
-
16
-
17
-
18
-
19
-
20
-
21
-
22
-
23
-
24
-
25
-
26
-
27
-
28
-
29
-
30
-
31
-
32
-
33
-
34
-
35
-
36
-
37
-
38
-
39
-
40
-
41
-
42
-
43
-
44
-
45
-
46
-
47
-
48
-
49
-
50
-
51
-
52
-
53
-
54
-
55
-
56
-
57
-
58
-
59
-
 60
60 -
 61
61 -
 62
62 -
 63
63 -
 64
64 -
 65
65 -
 66
66 -
 67
67 -
 68
68 -
 69
69 -
 70
70 -
 71
71 -
 72
72 -
 73
73 -
 74
74 -
 75
75 -
 76
76 -
 77
77 -
 78
78 -
 79
79 -
 80
80 -
81
-
82
-
83
-
84
-
85
-
86
-
87
-
88
-
89
-
90
-
91
-
92
-
93
-
94
-
95
-
96
-
97
-
98
-
99
-
100
-
101
-
102
-
103
-
104
-
105
-
106
-
107
-
108
-
109
-
110
-
111
-
112
-
113
-
114
 |
 |

65
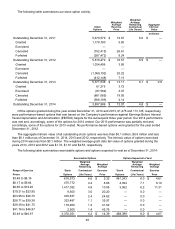
The following table summarizes our stock option activity:
Stock
Options
Weighted
Average
Exercise
Price
Weighted
Average
Remaining
Contractual
Life (Years)
Aggregate
Intrinsic
Value
(millions)
Outstanding December 31, 2011 5,679,579 $ 19.87 6.0 $ —
Granted 1,178,780 5.80
Exercised — —
Canceled (752,415) 26.61
Forfeited (287,472) 9.24
Outstanding December 31, 2012 5,818,472 $ 16.57 5.9 $ —
Granted 1,034,406 3.85
Exercised — —
Canceled (1,069,192) 25.22
Forfeited (412,148) 7.13
Outstanding December 31, 2013 5,371,538 $ 13.11 6.1 $ 0.8
Granted 61,275 3.72
Exercised (87,569) 3.97
Canceled (881,069) 19.05
Forfeited (566,189) 4.14
Outstanding December 31, 2014 3,897,986 $ 13.07 4.8 $ —
Of the options granted during the year ended December 31, 2014 and 2013, 61,275 and 113,125, respectively,
were performance-based options that vest based on the Company's performance against Earnings Before Interest
Taxes Depreciation and Amortization (EBITDA) targets for the subsequent three year period. Our 2014 performance
was met and, accordingly, some of the options for 2014 vested. Our 2013 performance was partially met and,
accordingly, some of the options for 2013 vested. No performance-based options were granted for the year ended
December 31, 2012.
The aggregate intrinsic value of all outstanding stock options was less than $0.1 million, $0.8 million and less
than $0.1 million as of December 31, 2014, 2013 and 2012, respectively. The intrinsic value of options exercised
during 2014 was less than $0.1 million. The weighted average grant date fair value of options granted during the
years 2014, 2013 and 2012 was $1.72, $1.61 and $2.53, respectively.
The following table summarizes exercisable options and options expected to vest as of December 31, 2014:
Exercisable Options Options Expected to Vest
Weighted
Average
Remaining Weighted
Average
Weighted
Average
Remaining Weighted
Average
Range of Exercise Stock Contractual Exercise Stock Contractual Exercise
Prices Options Life (Years) Price Options Life (Years) Price
$3.48 to $6.16 618,973 6.6 $ 5.32 481,243 8.0 $ 4.61
$6.17 to $9.64 475,772 4.4 8.66 4,094 7.1 6.19
$9.65 to $19.20 1,417,382 4.8 10.06 3,062 6.2 11.31
$19.21 to $23.95 9,500 3.0 20.20 — 0.0 —
$23.96 to $28.70 403,837 2.4 24.62 — 0.0 —
$28.71 to $39.38 323,487 1.1 35.97 — 0.0 —
$39.39 to $41.75 118,900 1.2 41.62 — 0.0 —
$41.76 to $46.97 2,500 1.4 45.76 — 0.0 —
$3.48 to $46.97 3,370,351 4.3 $ 14.39 488,399 8.0 $ 4.67