Memorex 2014 Annual Report Download - page 36
Download and view the complete annual report
Please find page 36 of the 2014 Memorex annual report below. You can navigate through the pages in the report by either clicking on the pages listed below, or by using the keyword search tool below to find specific information within the annual report.-
 1
1 -
2
-
3
-
4
-
5
-
6
-
7
-
8
-
9
-
10
-
11
-
12
-
13
-
14
-
15
-
16
-
17
-
18
-
19
-
20
-
21
-
22
-
23
-
24
-
25
-
 26
26 -
 27
27 -
 28
28 -
 29
29 -
 30
30 -
 31
31 -
 32
32 -
 33
33 -
 34
34 -
 35
35 -
 36
36 -
 37
37 -
 38
38 -
 39
39 -
 40
40 -
 41
41 -
 42
42 -
 43
43 -
 44
44 -
 45
45 -
 46
46 -
47
-
48
-
49
-
50
-
51
-
52
-
53
-
54
-
55
-
56
-
57
-
58
-
59
-
60
-
61
-
62
-
63
-
64
-
65
-
66
-
67
-
68
-
69
-
70
-
71
-
72
-
73
-
74
-
75
-
76
-
77
-
78
-
79
-
80
-
81
-
82
-
83
-
84
-
85
-
86
-
87
-
88
-
89
-
90
-
91
-
92
-
93
-
94
-
95
-
96
-
97
-
98
-
99
-
100
-
101
-
102
-
103
-
104
-
105
-
106
-
107
-
108
-
109
-
110
-
111
-
112
-
113
-
114
 |
 |

31
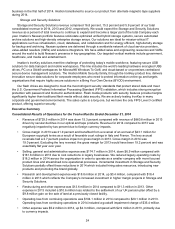
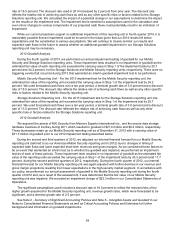
During the year ended December 31, 2014 we had $1.0 million of asset disposals and write downs related to
our Weatherford, Oklahoma facility and miscellaneous disposals of assets of $0.8 million. The $5.7 million of other
expenses includes certain employee costs and consulting fees.
During the year ended December 31, 2013 a gain of $9.8 million related to the sale of our Camarillo, California
manufacturing facility was recorded.
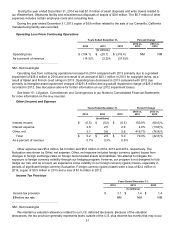
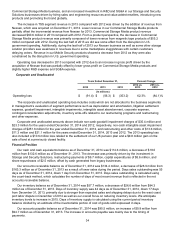
Operating Loss From Continuing Operations
Years Ended December 31, Percent Change
2014 2013 2012 2014 vs.
2013 2013 vs.
2012
(In millions)
Operating loss $ (104.1) $ (20.1) $ (318.4) NM NM
As a percent of revenue (14.3)% (2.3)% (31.6)%
_______________________________________
NM - Not meaningful
Operating loss from continuing operations increased in 2014 compared with 2013 primarily due to a goodwill
impairment of $35.4 million in 2014 and a reversal of an accrual of $23.1 million in 2013 for copyright levies, as a
result of Italian and French court rulings in 2013. Operating loss decreased in 2013 compared with 2012 due
primarily to intangible asset impairment charges of $251.8 million and a goodwill impairment charge of $23.3 million
recorded in 2012. See discussion above for further information on our 2012 impairment losses.
See Note 15 - Litigation, Commitments and Contingencies in our Notes to Consolidated Financial Statements
for more information on the levy reversal.
Other (Income) and Expense
Years Ended December 31, Percent Change
2014 2013 2012 2014 vs.
2013 2013 vs.
2012
(In millions)
Interest income $ (0.5) $ (0.2) $ (0.5) 150.0% (60.0)%
Interest expense 2.6 2.5 2.9 4.0% (13.8)%
Other, net 3.1 0.6 2.6 416.7% (76.9)%
Total $ 5.2 $ 2.9 $ 5.0 79.3% (42.0)%
As a percent of revenue 0.7% 0.3% 0.5%
Other expense was $5.2 million, $2.9 million and $5.0 million in 2014, 2013 and 2012, respectively. The
fluctuation was driven by Other, net expense. Other, net expense includes foreign currency (gains) losses from
changes in foreign exchange rates on foreign denominated assets and liabilities. We attempt to mitigate the
exposure to foreign currency volatility through our hedging program; however, our program is not designed to fully
hedge our risk, and as a result, we experience some volatility in our foreign currency (gains) losses, especially in
periods of significant foreign currency fluctuation. Foreign currency (gains) losses were a loss of $2.2 million in
2014, a gain of $0.5 million in 2013 and a loss of $1.6 million in 2012.
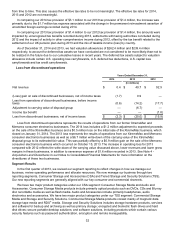
Income Tax Provision
Years Ended December 31,
2014 2013 2012
(In millions)
Income tax provision $ 3.1 $ 1.4 $ 1.4
Effective tax rate NM NM NM
_______________________________________
NM - Not meaningful
We maintain a valuation allowance related to our U.S. deferred tax assets. Because of the valuation
allowances, the tax provision generally represents taxes outside of the U.S. plus discrete tax events that may occur