Memorex 2014 Annual Report Download - page 74
Download and view the complete annual report
Please find page 74 of the 2014 Memorex annual report below. You can navigate through the pages in the report by either clicking on the pages listed below, or by using the keyword search tool below to find specific information within the annual report.-
 1
1 -
2
-
3
-
4
-
5
-
6
-
7
-
8
-
9
-
10
-
11
-
12
-
13
-
14
-
15
-
16
-
17
-
18
-
19
-
20
-
21
-
22
-
23
-
24
-
25
-
26
-
27
-
28
-
29
-
30
-
31
-
32
-
33
-
34
-
35
-
36
-
37
-
38
-
39
-
40
-
41
-
42
-
43
-
44
-
45
-
46
-
47
-
48
-
49
-
50
-
51
-
52
-
53
-
54
-
55
-
56
-
57
-
58
-
59
-
60
-
61
-
62
-
63
-
 64
64 -
 65
65 -
 66
66 -
 67
67 -
 68
68 -
 69
69 -
 70
70 -
 71
71 -
 72
72 -
 73
73 -
 74
74 -
 75
75 -
 76
76 -
 77
77 -
 78
78 -
 79
79 -
 80
80 -
 81
81 -
 82
82 -
 83
83 -
 84
84 -
85
-
86
-
87
-
88
-
89
-
90
-
91
-
92
-
93
-
94
-
95
-
96
-
97
-
98
-
99
-
100
-
101
-
102
-
103
-
104
-
105
-
106
-
107
-
108
-
109
-
110
-
111
-
112
-
113
-
114
 |
 |

69
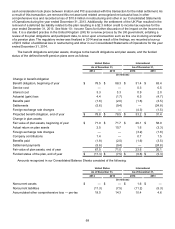
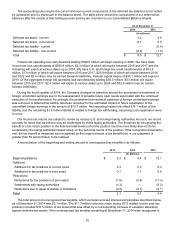
Pre-tax amounts recognized in accumulated other comprehensive loss consisted of the following:
United States International
As of December 31, As of December 31,
2014 2013 2014 2013
(In millions)
Net actuarial loss $ 19.0 $ 14.3 $ 12.1 $ 7.6
Prior service credit — — (2.2) (4.0)
Transition asset obligation — — 0.5 1.0
Total $ 19.0 $ 14.3 $ 10.4 $ 4.6
The following table includes information for pension plans with an accumulated benefit obligation in excess of
plan assets. The balances presented as of December 31, 2014 and 2013 exclude our Japan plan which had plan
assets in excess of accumulated benefit obligation for both years.
United States International
As of December 31, As of December 31,
2014 2013 2014 2013
(In millions)
Projected benefit obligation, end of year $ 78.8 $ 78.5 $ 28.7 $ 25.7
Accumulated benefit obligation, end of year 78.8 78.5 28.7 25.7
Plan assets at fair value, end of year 67.5 71.0 17.6 19.7
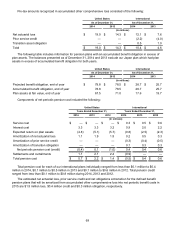
Components of net periodic pension cost included the following:
United States International
Years Ended December 31, Years Ended December 31,
2014 2013 2012 2014 2013 2012
(In millions)
Service cost $ —$ — $ — $ 0.3 $ 0.5 $ 0.6
Interest cost 3.3 3.3 3.2 0.9 2.0 2.2
Expected return on plan assets (4.8) (5.1) (5.7) (0.8) (2.5) (2.3)
Amortization of net actuarial loss 1.1 1.9 1.5 0.2 0.5 0.3
Amortization of prior service credit —— — (0.3) (0.4) (0.5)
Amortization of transition obligation —— — 0.1 0.3 0.3
Net periodic pension cost (credit) (0.4) 0.1 (1.0) 0.4 0.4 0.6
Settlements and curtailments 1.1 2.1 2.4 (0.9) — —
Total pension cost $ 0.7 $ 2.2 $ 1.4 $ (0.5) $ 0.4 $ 0.6
Total pension cost for each of our international plans individually ranged from less than $0.1 million to $0.4
million in 2014, $0.1 million to $0.5 million in 2013 and $0.1 million to $0.6 million in 2012. Total pension credit
ranged from less than $0.1 million to $0.8 million during 2014, 2013 and 2012.
The estimated net actuarial loss, prior service credit and net obligations at transition for the defined benefit
pension plans that will be amortized from accumulated other comprehensive loss into net periodic benefit costs in
2015 are $1.5 million loss, $0.4 million credit and $0.3 million obligation, respectively.