Memorex 2014 Annual Report Download - page 62
Download and view the complete annual report
Please find page 62 of the 2014 Memorex annual report below. You can navigate through the pages in the report by either clicking on the pages listed below, or by using the keyword search tool below to find specific information within the annual report.-
 1
1 -
2
-
3
-
4
-
5
-
6
-
7
-
8
-
9
-
10
-
11
-
12
-
13
-
14
-
15
-
16
-
17
-
18
-
19
-
20
-
21
-
22
-
23
-
24
-
25
-
26
-
27
-
28
-
29
-
30
-
31
-
32
-
33
-
34
-
35
-
36
-
37
-
38
-
39
-
40
-
41
-
42
-
43
-
44
-
45
-
46
-
47
-
48
-
49
-
50
-
51
-
 52
52 -
 53
53 -
 54
54 -
 55
55 -
 56
56 -
 57
57 -
 58
58 -
 59
59 -
 60
60 -
 61
61 -
 62
62 -
 63
63 -
 64
64 -
 65
65 -
 66
66 -
 67
67 -
 68
68 -
 69
69 -
 70
70 -
 71
71 -
 72
72 -
73
-
74
-
75
-
76
-
77
-
78
-
79
-
80
-
81
-
82
-
83
-
84
-
85
-
86
-
87
-
88
-
89
-
90
-
91
-
92
-
93
-
94
-
95
-
96
-
97
-
98
-
99
-
100
-
101
-
102
-
103
-
104
-
105
-
106
-
107
-
108
-
109
-
110
-
111
-
112
-
113
-
114
 |
 |

57
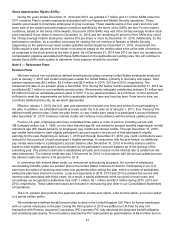
million of cash consideration received at closing and an interest-bearing note receivable of $0.3 million due on
December 15, 2015. The sales price also included additional future cash consideration originally estimated at $3.0
million and which was based on the proceeds the purchaser was able to achieve from selling the acquired
inventory. During 2013, we adjusted downward our estimate of the expected consideration to be received by $1.2
million. Accordingly, we adjusted the carrying value of the XtremeMac disposal group, and recorded a charge of
$1.2 million in 2013 which brought our total full-year 2013 impairment charge associated with this disposal group
to $6.7 million. We recorded a charge of $1.2 million in 2014 which is included in the loss on sale of discontinued
businesses. The impairment charges are recorded as an element of discontinued operations.
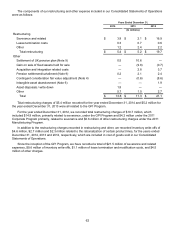
The operating results for these businesses are presented in our Consolidated Statements of Operations as
discontinued operations for all periods presented and reflect revenues and expenses that are directly attributable
to these businesses that were eliminated from our ongoing operations. See Note 7 - Restructuring and Other for
disclosure of severance expense that was recorded relating to these planned divestitures.
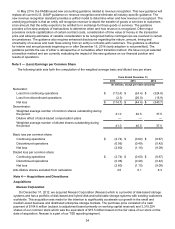
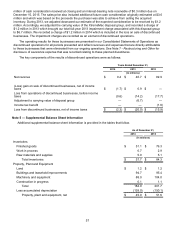
The key components of the results of discontinued operations were as follows:
Years Ended December 31,
2014 2013 2012
(In millions)
Net revenue $ 0.4 $ 40.7 $ 92.9
(Loss) gain on sale of discontinued businesses, net of income
taxes $ (1.7) $ 0.9 $ —
Loss from operations of discontinued businesses, before income
taxes (0.6) (14.2) (17.7)
Adjustment to carrying value of disposal group — (6.7) —
Income tax benefit — — (1.8)
Loss from discontinued businesses, net of income taxes $ (2.3) $ (20.0) $ (15.9)
Note 5 — Supplemental Balance Sheet Information
Additional supplemental balance sheet information is provided in the tables that follow.
As of December 31,
2014 2013
(In millions)
Inventories
Finished goods $ 51.1 $ 76.3
Work in process 0.7 2.9
Raw materials and supplies 5.9 5.1
Total inventories $ 57.7 $ 84.3
Property, Plant and Equipment
Land $ 1.2 $ 1.2
Buildings and leasehold improvements 94.7 95.4
Machinery and equipment 88.0 104.0
Construction in progress 0.1 1.1
Total 184.0 201.7
Less accumulated depreciation (139.0) (150.1)
Property, plant and equipment, net $ 45.0 $ 51.6