Memorex 2014 Annual Report Download - page 53
Download and view the complete annual report
Please find page 53 of the 2014 Memorex annual report below. You can navigate through the pages in the report by either clicking on the pages listed below, or by using the keyword search tool below to find specific information within the annual report.-
 1
1 -
2
-
3
-
4
-
5
-
6
-
7
-
8
-
9
-
10
-
11
-
12
-
13
-
14
-
15
-
16
-
17
-
18
-
19
-
20
-
21
-
22
-
23
-
24
-
25
-
26
-
27
-
28
-
29
-
30
-
31
-
32
-
33
-
34
-
35
-
36
-
37
-
38
-
39
-
40
-
41
-
42
-
 43
43 -
 44
44 -
 45
45 -
 46
46 -
 47
47 -
 48
48 -
 49
49 -
 50
50 -
 51
51 -
 52
52 -
 53
53 -
 54
54 -
 55
55 -
 56
56 -
 57
57 -
 58
58 -
 59
59 -
 60
60 -
 61
61 -
 62
62 -
 63
63 -
64
-
65
-
66
-
67
-
68
-
69
-
70
-
71
-
72
-
73
-
74
-
75
-
76
-
77
-
78
-
79
-
80
-
81
-
82
-
83
-
84
-
85
-
86
-
87
-
88
-
89
-
90
-
91
-
92
-
93
-
94
-
95
-
96
-
97
-
98
-
99
-
100
-
101
-
102
-
103
-
104
-
105
-
106
-
107
-
108
-
109
-
110
-
111
-
112
-
113
-
114
 |
 |

48
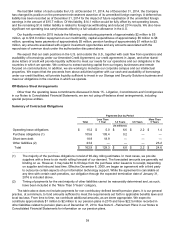
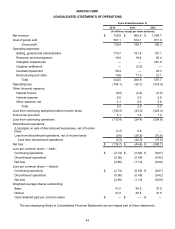
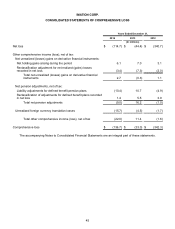
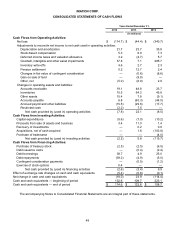
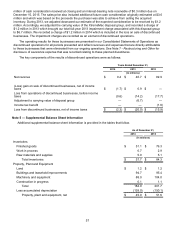
IMATION CORP.
CONSOLIDATED STATEMENTS OF CASH FLOWS
Years Ended December 31,
2014 2013 2012
(In millions)
Cash Flows from Operating Activities:
Net loss $ (114.7) $ (44.4) $ (340.7)
Adjustments to reconcile net income to net cash used in operating activities:
Depreciation and amortization 21.7 23.7 35.8
Stock-based compensation 5.3 6.9 7.3
Deferred income taxes and valuation allowance 3.2 (4.7) 5.7
Goodwill, intangible and other asset impairments 37.8 7.1 285.7
Inventory write-offs 4.6 2.7 2.3
Pension settlement 0.2 12.7 2.4
Changes in fair value of contingent consideration — (0.6) (8.6)
Gain on sale of land — (9.8) —
Other, net (5.0) (6.9) 2.9
Changes in operating assets and liabilities:
Accounts receivable 19.1 48.8 23.7
Inventories 15.5 64.2 45.8
Other assets 15.4 7.8 (9.1)
Accounts payable 6.8 (63.3) (44.0)
Accrued payroll and other liabilities (15.5) (29.6) (17.7)
Restricted cash (2.2) 7.5 —
Net cash provided by (used in) operating activities (7.8) 22.1 (8.5)
Cash Flows from Investing Activities:
Capital expenditures (5.6) (7.0) (10.2)
Proceeds from sale of assets and business 3.4 11.0 1.4
Recovery of investments — 0.2 0.9
Acquisitions, net of cash acquired — 1.6 (103.8)
Purchase of tradename — — (4.0)
Net cash provided by (used in) investing activities (2.2) 5.8 (115.7)
Cash Flows from Financing Activities:
Purchase of treasury stock (2.5) (2.5) (6.5)
Debt issuance costs — (0.4) (2.4)
Debt borrowings 38.7 4.9 25.0
Debt repayments (39.2) (4.9) (5.0)
Contingent consideration payments — (0.5) (1.2)
Exercise of stock options 0.4 — —
Net cash provided by (used in) financing activities (2.6) (3.4) 9.9
Effect of exchange rate changes on cash and cash equivalents (5.4) (0.6) (0.1)
Net change in cash and cash equivalents (18.0) 23.9 (114.4)
Cash and cash equivalents — beginning of period 132.6 108.7 223.1
Cash and cash equivalents — end of period $ 114.6 $ 132.6 $ 108.7
The accompanying Notes to Consolidated Financial Statements are an integral part of these statements.