Memorex 2014 Annual Report Download - page 26
Download and view the complete annual report
Please find page 26 of the 2014 Memorex annual report below. You can navigate through the pages in the report by either clicking on the pages listed below, or by using the keyword search tool below to find specific information within the annual report.-
 1
1 -
2
-
3
-
4
-
5
-
6
-
7
-
8
-
9
-
10
-
11
-
12
-
13
-
14
-
15
-
 16
16 -
 17
17 -
 18
18 -
 19
19 -
 20
20 -
 21
21 -
 22
22 -
 23
23 -
 24
24 -
 25
25 -
 26
26 -
 27
27 -
 28
28 -
 29
29 -
 30
30 -
 31
31 -
 32
32 -
 33
33 -
 34
34 -
 35
35 -
 36
36 -
37
-
38
-
39
-
40
-
41
-
42
-
43
-
44
-
45
-
46
-
47
-
48
-
49
-
50
-
51
-
52
-
53
-
54
-
55
-
56
-
57
-
58
-
59
-
60
-
61
-
62
-
63
-
64
-
65
-
66
-
67
-
68
-
69
-
70
-
71
-
72
-
73
-
74
-
75
-
76
-
77
-
78
-
79
-
80
-
81
-
82
-
83
-
84
-
85
-
86
-
87
-
88
-
89
-
90
-
91
-
92
-
93
-
94
-
95
-
96
-
97
-
98
-
99
-
100
-
101
-
102
-
103
-
104
-
105
-
106
-
107
-
108
-
109
-
110
-
111
-
112
-
113
-
114
 |
 |

21
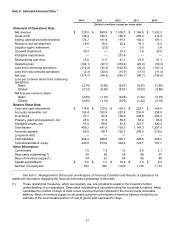
Item 6. Selected Financial Data.*
2014 2013 2012 2011 2010
(Dollars in millions, except per share data)
Statement of Operations Data:
Net revenue $ 729.5 $ 860.8 $ 1,006.7 $ 1,166.6 $ 1,302.3
Gross profit 138.4 188.7 189.3 205.4 212.2
Selling, general and administrative 174.7 181.6 191.1 182.4 181.1
Research and development 18.8 18.4 20.4 18.3 13.2
Litigation (gain) settlement — (2.5) — 2.0 2.6
Goodwill impairment 35.4 — 23.3 1.6 23.5
Intangible impairments — — 251.8 — —
Restructuring and other 13.6 11.3 21.1 21.5 51.1
Operating loss (104.1) (20.1) (318.4) (20.4) (59.3)
Loss from continuing operations (112.4) (24.4) (324.8) (35.2) (147.1)
Loss from discontinued operations (2.3) (20.0) (15.9) (11.5) (11.4)
Net loss (114.7) (44.4) (340.7) (46.7) (158.5)
Loss per common share from continuing
operations:
Basic (2.74) (0.60) (8.67) (0.93) (3.89)
Diluted (2.74) (0.60) (8.67) (0.93) (3.89)
Net loss per common share:
Basic (2.80) (1.10) (9.09) (1.24) (4.19)
Diluted (2.80) (1.10) (9.09) (1.24) (4.19)
Balance Sheet Data:
Cash and cash equivalents $ 114.6 $ 132.6 $ 108.7 $ 223.1 $ 304.9
Accounts receivable, net 134.4 163.3 220.8 234.9 258.8
Inventories 57.7 84.3 166.0 208.8 203.3
Property, plant and equipment, net 45.0 51.6 58.9 55.4 66.9
Intangible assets, net 57.9 68.6 81.9 321.7 320.4
Total assets 499.2 641.8 793.5 1,149.3 1,251.0
Accounts payable 95.5 94.7 162.7 205.2 219.2
Long-term debt — — — — —
Total liabilities 258.4 268.6 393.1 425.6 469.3
Total shareholders’ equity 240.8 373.2 400.4 723.7 781.7
Other Information:
Current ratio 1.6 1.9 1.6 2.0 2.1
Days sales outstanding(1) 55 56 59 58 57
Days of inventory supply(1) 44 61 89 85 69
Capital expenditures $ 5.6 $ 7.0 $ 10.2 $ 7.3 $ 8.3
Number of employees 910 940 1,230 1,130 1,115
_______________________________________
* See Item 7. Management’s Discussion and Analysis of Financial Condition and Results of Operations for
additional information regarding the financial information presented in this table.
(1) These operational measures, which we regularly use, are provided to assist in the investor’s further
understanding of our operations. Days sales outstanding is calculated using the count-back method, which
calculates the number of days of most recent revenue that are reflected in the net accounts receivable
balance. Days of inventory supply is calculated using the current period inventory balance divided by an
estimate of the inventoriable portion of cost of goods sold expressed in days.