Memorex 2014 Annual Report Download - page 40
Download and view the complete annual report
Please find page 40 of the 2014 Memorex annual report below. You can navigate through the pages in the report by either clicking on the pages listed below, or by using the keyword search tool below to find specific information within the annual report.-
 1
1 -
2
-
3
-
4
-
5
-
6
-
7
-
8
-
9
-
10
-
11
-
12
-
13
-
14
-
15
-
16
-
17
-
18
-
19
-
20
-
21
-
22
-
23
-
24
-
25
-
26
-
27
-
28
-
29
-
 30
30 -
 31
31 -
 32
32 -
 33
33 -
 34
34 -
 35
35 -
 36
36 -
 37
37 -
 38
38 -
 39
39 -
 40
40 -
 41
41 -
 42
42 -
 43
43 -
 44
44 -
 45
45 -
 46
46 -
 47
47 -
 48
48 -
 49
49 -
 50
50 -
51
-
52
-
53
-
54
-
55
-
56
-
57
-
58
-
59
-
60
-
61
-
62
-
63
-
64
-
65
-
66
-
67
-
68
-
69
-
70
-
71
-
72
-
73
-
74
-
75
-
76
-
77
-
78
-
79
-
80
-
81
-
82
-
83
-
84
-
85
-
86
-
87
-
88
-
89
-
90
-
91
-
92
-
93
-
94
-
95
-
96
-
97
-
98
-
99
-
100
-
101
-
102
-
103
-
104
-
105
-
106
-
107
-
108
-
109
-
110
-
111
-
112
-
113
-
114
 |
 |

35
Liquidity and Capital Resources
We have various resources available to us for purposes of managing liquidity and capital needs, including our
credit facilities and letters of credit. Our primary sources of liquidity include cash flows generated by the sale of our
products, our cash and cash equivalents and credit capacity under our credit facilities. Our primary operating
liquidity needs relate to our working capital and funding our operations.
Cash and Cash Equivalents
Cash equivalents consist of highly liquid investments purchased with original maturities of three months or less.
Restricted cash is related to contractual obligations or restricted by management and is included in other assets on
our Consolidated Balance Sheets. Our restricted cash balance as of December 31, 2014 was $2.2 million which
relates to cash set aside as indemnification for certain customers. No restricted cash was held at December 31,
2013.
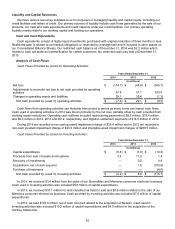
Analysis of Cash Flows
Cash Flows Provided by (Used In) Operating Activities:
Years Ended December 31,
2014 2013 2012
(In millions)
Net loss $ (114.7) $ (44.4) $ (340.7)
Adjustments to reconcile net loss to net cash provided by operating
activities 67.8 31.1 333.5
Changes in operating assets and liabilities 39.1 35.4 (1.3)
Net cash provided by (used in) operating activities $ (7.8) $ 22.1 $ (8.5)
Cash flows from operating activities can fluctuate from period to period as many items can impact cash flows.
Cash used in operating activities in 2014 was driven primarily by the net loss, partially offset by cash provided from
working capital reductions. Operating cash outflows included restructuring payments of $6.7 million, $19.4 million
and $8.0 million in 2014, 2013 and 2012, respectively, and litigation settlement payments of $18.5 million in 2012.
During 2014 we recorded a non-cash goodwill impairment charge of $35.4 million and in 2012 we recorded a
non-cash goodwill impairment charge of $23.3 million and intangible asset impairment charges of $260.5 million.
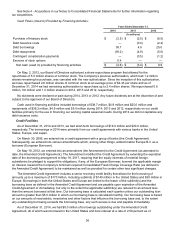
Cash Flows Provided by (Used in) Investing Activities:
Years Ended December 31,
2014 2013 2012
(In millions)
Capital expenditures $ (5.6) $ (7.0) $ (10.2)
Proceeds from sale of assets and business 3.4 11.0 1.4
Recovery of investments — 0.2 0.9
Acquisitions, net of cash acquired — 1.6 (103.8)
Purchase of tradename — — (4.0)
Net cash provided by (used in) investing activities $ (2.2) $ 5.8 $ (115.7)
In 2014, we received $3.4 million from the sales of our XtremeMac and Memorex consumer electronic business.
Cash used in investing activities also included $5.6 million of capital expenditures.
In 2013, we received $10.1 million for land classified as held for sale and $0.9 million related to the sale of our
Memorex consumer electronics business. Cash provided by investing activities also included $7.0 million of capital
expenditures.
In 2012, we paid $103.8 million net of cash received related to the acquisition of Nexsan. Cash used in
investing activities also included $10.2 million of capital expenditures and $4.0 million for the acquisition of the
IronKey tradename.