Memorex 2014 Annual Report Download - page 39
Download and view the complete annual report
Please find page 39 of the 2014 Memorex annual report below. You can navigate through the pages in the report by either clicking on the pages listed below, or by using the keyword search tool below to find specific information within the annual report.-
 1
1 -
2
-
3
-
4
-
5
-
6
-
7
-
8
-
9
-
10
-
11
-
12
-
13
-
14
-
15
-
16
-
17
-
18
-
19
-
20
-
21
-
22
-
23
-
24
-
25
-
26
-
27
-
28
-
 29
29 -
 30
30 -
 31
31 -
 32
32 -
 33
33 -
 34
34 -
 35
35 -
 36
36 -
 37
37 -
 38
38 -
 39
39 -
 40
40 -
 41
41 -
 42
42 -
 43
43 -
 44
44 -
 45
45 -
 46
46 -
 47
47 -
 48
48 -
 49
49 -
50
-
51
-
52
-
53
-
54
-
55
-
56
-
57
-
58
-
59
-
60
-
61
-
62
-
63
-
64
-
65
-
66
-
67
-
68
-
69
-
70
-
71
-
72
-
73
-
74
-
75
-
76
-
77
-
78
-
79
-
80
-
81
-
82
-
83
-
84
-
85
-
86
-
87
-
88
-
89
-
90
-
91
-
92
-
93
-
94
-
95
-
96
-
97
-
98
-
99
-
100
-
101
-
102
-
103
-
104
-
105
-
106
-
107
-
108
-
109
-
110
-
111
-
112
-
113
-
114
 |
 |

34
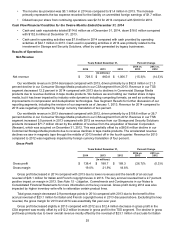
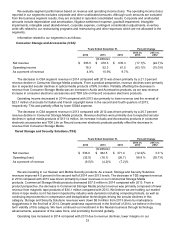
Commercial Storage Media business, and an increased investment in R&D and SG&A in our Storage and Security
Solutions businesses driven by hiring sales and engineering resources and value-added resellers, introducing new
products and promoting the brand globally.
The increase in TSS segment revenue in 2013 compared with 2012 was driven by the addition of revenue from
Nexsan, which was acquired on December 31, 2012. Lower revenue in our Commercial Storage Media products
partially offset the incremental revenue from Nexsan for 2013. Commercial Storage Media product revenue
decreased $60.6 million in 2013 compared with 2012. From a product perspective, the decrease in Commercial
Storage Media product revenue was primarily composed of lower revenue from magnetic tape products of $55.2
million compared with 2012. During the last half of 2013 we did see some effect from the disruption in U.S.
government spending. Additionally, during the last half of 2013 our Nexsan business as well as some other storage
solution providers saw weakness in revenues due to some marketplace sluggishness with certain customers
delaying orders. Revenue in our Mobile Security products showed a decrease from 2012 as they were also
constrained by the disruption in U.S. government spending.
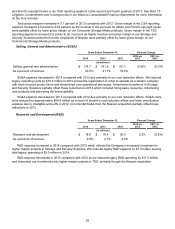
Operating loss decreased in 2013 compared with 2012 due to an increase in gross profit driven by the
acquisition of Nexsan that was partially offset by lower gross profit on Commercial Storage Media products and
slightly higher R&D expense and SG&A expense.
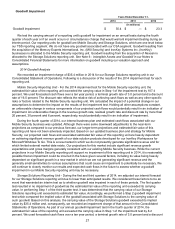
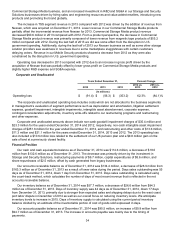
Corporate and Unallocated
Years Ended December 31, Percent Change
2014 2013 2012 2014 vs.
2013 2013 vs.
2012
(In millions)
Operating loss $ (91.4) $ (56.3) $ (353.2) 62.3% (84.1)%
The corporate and unallocated operating loss includes costs which are not allocated to the business segments
in management’s evaluation of segment performance such as depreciation and amortization, litigation settlement
expense, goodwill impairment, intangible impairments, intangible asset abandonment, corporate expense,
contingent consideration adjustments, inventory write-offs related to our restructuring programs and restructuring
and other expenses.
Corporate and unallocated amounts above include non-cash goodwill impairment charges of $35.4 million and
$23.3 million for the years ended December 31, 2014 and 2012, respectively, non-cash intangible asset impairment
charges of $251.8 million for the year ended December 31, 2012, and restructuring and other costs of $13.6 million,
$11.3 million and $21.1 million for the years ended December 31, 2014, 2013 and 2012. The 2013 operating loss
also included a $10.6 million loss related to the settlement of our UK pension plan and a $9.8 million gain on the
sale of land at a previously closed facility.
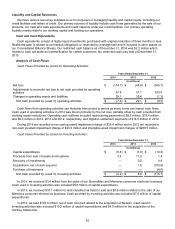
Financial Position
Our cash and cash equivalents balance as of December 31, 2014 was $114.6 million, a decrease of $18.0
million from $132.6 million as of December 31, 2013. The decrease was primarily driven by the investment in
Storage and Security Solutions, restructuring payments of $6.7 million, capital expenditures of $5.6 million, and
share repurchases of $2.5 million, offset by cash generated from legacy businesses.
Our accounts receivable balance as of December 31, 2014 was $134.4 million, a decrease of $28.9 million from
$163.3 million as of December 31, 2013 as a result of lower sales during the period. Days sales outstanding was 55
days as of December 31, 2014, down 1 day from December 31, 2013. Days sales outstanding is calculated using
the count-back method, which calculates the number of days of most recent revenue that is reflected in the net
accounts receivable balance.
Our inventory balance as of December 31, 2014 was $57.7 million, a decrease of $26.6 million from $84.3
million as of December 31, 2013. Days of inventory supply was 44 days as of December 31, 2014, down 17 days
from December 31, 2013, primarily due to stronger than expected sales and shipping delays due to the west coast
port labor dispute in December of 2014 as well as our overall focus on reducing inventory levels. We anticipate
inventory levels to increase in 2015. Days of inventory supply is calculated using the current period inventory
balance divided by an estimate of the inventoriable portion of cost of goods sold expressed in days.
Our accounts payable balance as of December 31, 2014 was $95.5 million, an increase of $0.8 million from
$94.7 million as of December 31, 2013. The increase in accounts payable was mainly due to the timing of
payments.