Memorex 2014 Annual Report Download - page 65
Download and view the complete annual report
Please find page 65 of the 2014 Memorex annual report below. You can navigate through the pages in the report by either clicking on the pages listed below, or by using the keyword search tool below to find specific information within the annual report.-
 1
1 -
2
-
3
-
4
-
5
-
6
-
7
-
8
-
9
-
10
-
11
-
12
-
13
-
14
-
15
-
16
-
17
-
18
-
19
-
20
-
21
-
22
-
23
-
24
-
25
-
26
-
27
-
28
-
29
-
30
-
31
-
32
-
33
-
34
-
35
-
36
-
37
-
38
-
39
-
40
-
41
-
42
-
43
-
44
-
45
-
46
-
47
-
48
-
49
-
50
-
51
-
52
-
53
-
54
-
 55
55 -
 56
56 -
 57
57 -
 58
58 -
 59
59 -
 60
60 -
 61
61 -
 62
62 -
 63
63 -
 64
64 -
 65
65 -
 66
66 -
 67
67 -
 68
68 -
 69
69 -
 70
70 -
 71
71 -
 72
72 -
 73
73 -
 74
74 -
 75
75 -
76
-
77
-
78
-
79
-
80
-
81
-
82
-
83
-
84
-
85
-
86
-
87
-
88
-
89
-
90
-
91
-
92
-
93
-
94
-
95
-
96
-
97
-
98
-
99
-
100
-
101
-
102
-
103
-
104
-
105
-
106
-
107
-
108
-
109
-
110
-
111
-
112
-
113
-
114
 |
 |

60
Goodwill
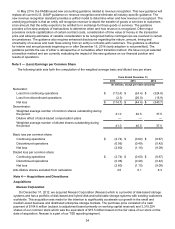
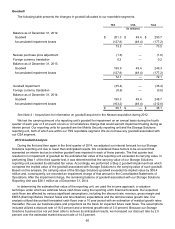
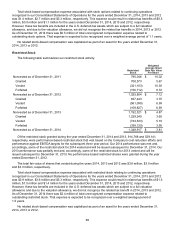
The following table presents the changes in goodwill allocated to our reportable segments:
TSS CSA Total
(In millions)
Balance as of December 31, 2012:
Goodwill $ 201.3 $ 49.4 $ 250.7
Accumulated impairment losses (127.8) (49.4) (177.2)
73.5 — 73.5
Nexsan purchase price adjustment (1.6) — (1.6)
Foreign currency translation 0.2 — 0.2
Balance as of December 31, 2013:
Goodwill 199.9 49.4 249.3
Accumulated impairment losses (127.8) (49.4) (177.2)
72.1 — 72.1
Goodwill impairment (35.4) — (35.4)
Foreign currency translation (0.6) — (0.6)
Balance as of December 31, 2014:
Goodwill 199.3 49.4 248.7
Accumulated impairment losses (163.2) (49.4) (212.6)
$ 36.1 $ — $ 36.1
See Note 4 - Acquisitions for information on goodwill acquired in the Nexsan acquisition during 2012.
We test the carrying amount of a reporting unit's goodwill for impairment on an annual basis during the fourth
quarter of each year or if an event occurs or circumstances change that would warrant impairment testing during an
interim period. Our reporting units for goodwill are the Mobile Security reporting unit and the Storage Solutions
reporting unit, both of which are within our TSS reportable segment. We do not have any goodwill associated with
our CSA segment.
2014 Goodwill Analysis
During the first and then again in the third quarter of 2014, we adjusted our internal forecast for our Storage
Solutions reporting unit due to lower than anticipated results. We considered these factors to be an event that
warranted an interim test as to whether goodwill was impaired in each of these periods. The first quarter test
resulted in no impairment of goodwill as the estimated fair value of the reporting unit exceeded its carrying value. In
performing Step 1 of the third quarter test, it was determined that the carrying value of our Storage Solutions
reporting unit exceeded its estimated fair value. Accordingly, we performed a Step 2 goodwill impairment test which
compared the implied value of the goodwill associated with Storage Solutions to the carrying value of such goodwill.
Based on this analysis, the carrying value of the Storage Solutions goodwill exceeded its implied value by $35.4
million and, consequently, we recorded an impairment charge of that amount in the Consolidated Statements of
Operations. After the impairment charge, the remaining balance of goodwill associated with our Storage Solutions
Reporting Unit was $28.1 million as of December 31, 2014.
In determining the estimated fair value of the reporting unit, we used the income approach, a valuation
technique under which we estimate future cash flows using the reporting unit's financial forecasts. Our expected
cash flows are affected by various significant assumptions, including the discount rate, revenue, gross margin and
EBITA (Earnings Before Interest Taxes and Amortization) expectations and the terminal value growth rate. Our
analysis utilized discounted forecasted cash flows over a 10 year period with an estimation of residual growth rates
thereafter. We use our business plans and projections as the basis for expected future cash flows. The assumptions
included utilized a discount rate of 16.5 percent and a terminal growth rate of 3.0 percent. Because our Storage
Solutions business has not yet been able to achieve its anticipated results, we increased our discount rate by 2.0
percent over the estimated market discount rate of 14.5 percent.