Loreal 2011 Annual Report Download - page 77
Download and view the complete annual report
Please find page 77 of the 2011 Loreal annual report below. You can navigate through the pages in the report by either clicking on the pages listed below, or by using the keyword search tool below to find specific information within the annual report.-
 1
1 -
2
-
3
-
4
-
5
-
6
-
7
-
8
-
9
-
10
-
11
-
12
-
13
-
14
-
15
-
16
-
17
-
18
-
19
-
20
-
21
-
22
-
23
-
24
-
25
-
26
-
27
-
28
-
29
-
30
-
31
-
32
-
33
-
34
-
35
-
36
-
37
-
38
-
39
-
40
-
41
-
42
-
43
-
44
-
45
-
46
-
47
-
48
-
49
-
50
-
51
-
52
-
53
-
54
-
55
-
56
-
57
-
58
-
59
-
60
-
61
-
62
-
63
-
64
-
65
-
66
-
 67
67 -
 68
68 -
 69
69 -
 70
70 -
 71
71 -
 72
72 -
 73
73 -
 74
74 -
 75
75 -
 76
76 -
 77
77 -
 78
78 -
 79
79 -
 80
80 -
 81
81 -
 82
82 -
 83
83 -
 84
84 -
 85
85 -
 86
86 -
 87
87 -
88
-
89
-
90
-
91
-
92
-
93
-
94
-
95
-
96
-
97
-
98
-
99
-
100
-
101
-
102
-
103
-
104
-
105
-
106
-
107
-
108
-
109
-
110
-
111
-
112
-
113
-
114
-
115
-
116
-
117
-
118
-
119
-
120
-
121
-
122
-
123
-
124
-
125
-
126
-
127
-
128
-
129
-
130
-
131
-
132
-
133
-
134
-
135
-
136
-
137
-
138
-
139
-
140
-
141
-
142
-
143
-
144
-
145
-
146
-
147
-
148
-
149
-
150
-
151
-
152
-
153
-
154
-
155
-
156
-
157
-
158
-
159
-
160
-
161
-
162
-
163
-
164
-
165
-
166
-
167
-
168
-
169
-
170
-
171
-
172
-
173
-
174
-
175
-
176
-
177
-
178
-
179
-
180
-
181
-
182
-
183
-
184
-
185
-
186
-
187
-
188
-
189
-
190
-
191
-
192
-
193
-
194
-
195
-
196
-
197
-
198
-
199
-
200
-
201
-
202
-
203
-
204
-
205
-
206
-
207
-
208
-
209
-
210
-
211
-
212
-
213
-
214
-
215
-
216
-
217
-
218
-
219
-
220
-
221
-
222
-
223
-
224
-
225
-
226
-
227
-
228
-
229
-
230
-
231
-
232
-
233
-
234
-
235
-
236
-
237
-
238
-
239
-
240
-
241
-
242
-
243
-
244
-
245
-
246
 |
 |

75REGISTRATION DOCUMENT − L’ORÉAL 2011
Comments on the2011 nancialyear
3
The Group's business activities in 2011
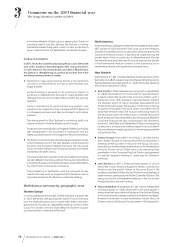
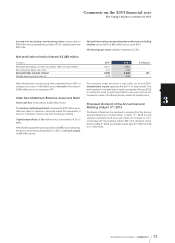
Income tax excluding non-recurring items amounted to
978 million euros, representing a rate of 27.4%, slightly below the
2010 rate.
Net profit excluding non-recurring items after non-controlling
interests amounted to 2,583 million euros, up by 8.9%.
Net earnings per share, at €4.32, increased by 7.8%.
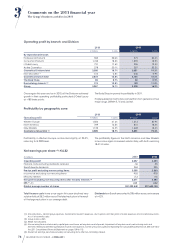
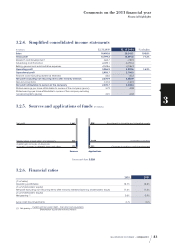
Net profit after minority interest: €2,438 million
€ millions
2010 2011 Evolution
Net profit excluding non-recurring items after minority interest 2,371 2,583
Non-recurring items net of tax -131 -145
Net profit after minority interest 2,240 2,438 +9%
Diluted earnings per share (€) 3.79 4.08
After allowing for non-recurring items, representing in2011 a
charge, net of tax, of 145 million euros, net profit amounted to
2,438 million euros, an increase of 9%.
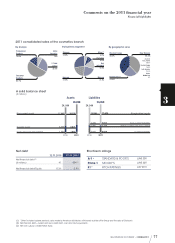
Cash flow Statement, Balance sheet and Debt
Gross cash flow amounted to 3,226 million euros.
The working capital requirement increased by 322 million euros,
after two years of decline in absolute value. This represents a
return to a situation more in line with the Group’s activity.
Capital expenditure, at 866 million euros, amounted to 4.3% of
sales.
After dividend payment and acquisitions (Q-MED and
Clarisonic
),
the Group recorded at December31st, 2011, a net cash surplus
of 504million euros.
The balance sheet structure is very solid, as at end-2011
shareholders’ equity represented 65.7% of total assets. The
reinforcement of shareholders’ equity compared with end-2010
is mainly the result of profit allocated to reserves and the net
increase in value of the Sanofi shares, valued at market price.
Proposed dividend at the Annual General
Meeting of April17th, 2012
The Board of Directors has decided to propose that the Annual
General Meeting of shareholders of April17th, 2012 should
approve a dividend of 2euros per share, an increase of +11%
compared with the dividend paid in2011. This dividend will be
paid on May3rd, 2012 (ex-dividend date April27th, 2012 at 0:00
a.m., Paris time).