Loreal 2011 Annual Report Download - page 119
Download and view the complete annual report
Please find page 119 of the 2011 Loreal annual report below. You can navigate through the pages in the report by either clicking on the pages listed below, or by using the keyword search tool below to find specific information within the annual report.-
 1
1 -
2
-
3
-
4
-
5
-
6
-
7
-
8
-
9
-
10
-
11
-
12
-
13
-
14
-
15
-
16
-
17
-
18
-
19
-
20
-
21
-
22
-
23
-
24
-
25
-
26
-
27
-
28
-
29
-
30
-
31
-
32
-
33
-
34
-
35
-
36
-
37
-
38
-
39
-
40
-
41
-
42
-
43
-
44
-
45
-
46
-
47
-
48
-
49
-
50
-
51
-
52
-
53
-
54
-
55
-
56
-
57
-
58
-
59
-
60
-
61
-
62
-
63
-
64
-
65
-
66
-
67
-
68
-
69
-
70
-
71
-
72
-
73
-
74
-
75
-
76
-
77
-
78
-
79
-
80
-
81
-
82
-
83
-
84
-
85
-
86
-
87
-
88
-
89
-
90
-
91
-
92
-
93
-
94
-
95
-
96
-
97
-
98
-
99
-
100
-
101
-
102
-
103
-
104
-
105
-
106
-
107
-
108
-
 109
109 -
 110
110 -
 111
111 -
 112
112 -
 113
113 -
 114
114 -
 115
115 -
 116
116 -
 117
117 -
 118
118 -
 119
119 -
 120
120 -
 121
121 -
 122
122 -
 123
123 -
 124
124 -
 125
125 -
 126
126 -
 127
127 -
 128
128 -
 129
129 -
130
-
131
-
132
-
133
-
134
-
135
-
136
-
137
-
138
-
139
-
140
-
141
-
142
-
143
-
144
-
145
-
146
-
147
-
148
-
149
-
150
-
151
-
152
-
153
-
154
-
155
-
156
-
157
-
158
-
159
-
160
-
161
-
162
-
163
-
164
-
165
-
166
-
167
-
168
-
169
-
170
-
171
-
172
-
173
-
174
-
175
-
176
-
177
-
178
-
179
-
180
-
181
-
182
-
183
-
184
-
185
-
186
-
187
-
188
-
189
-
190
-
191
-
192
-
193
-
194
-
195
-
196
-
197
-
198
-
199
-
200
-
201
-
202
-
203
-
204
-
205
-
206
-
207
-
208
-
209
-
210
-
211
-
212
-
213
-
214
-
215
-
216
-
217
-
218
-
219
-
220
-
221
-
222
-
223
-
224
-
225
-
226
-
227
-
228
-
229
-
230
-
231
-
232
-
233
-
234
-
235
-
236
-
237
-
238
-
239
-
240
-
241
-
242
-
243
-
244
-
245
-
246
 |
 |
117REGISTRATION DOCUMENT − L’ORÉAL 2011
2011 Consolidated Financial Statements
4
Notes to the consolidated nancial statements
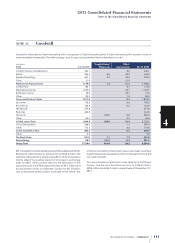
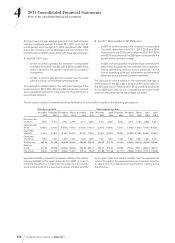
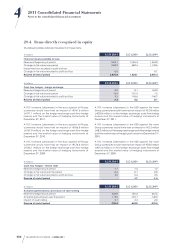
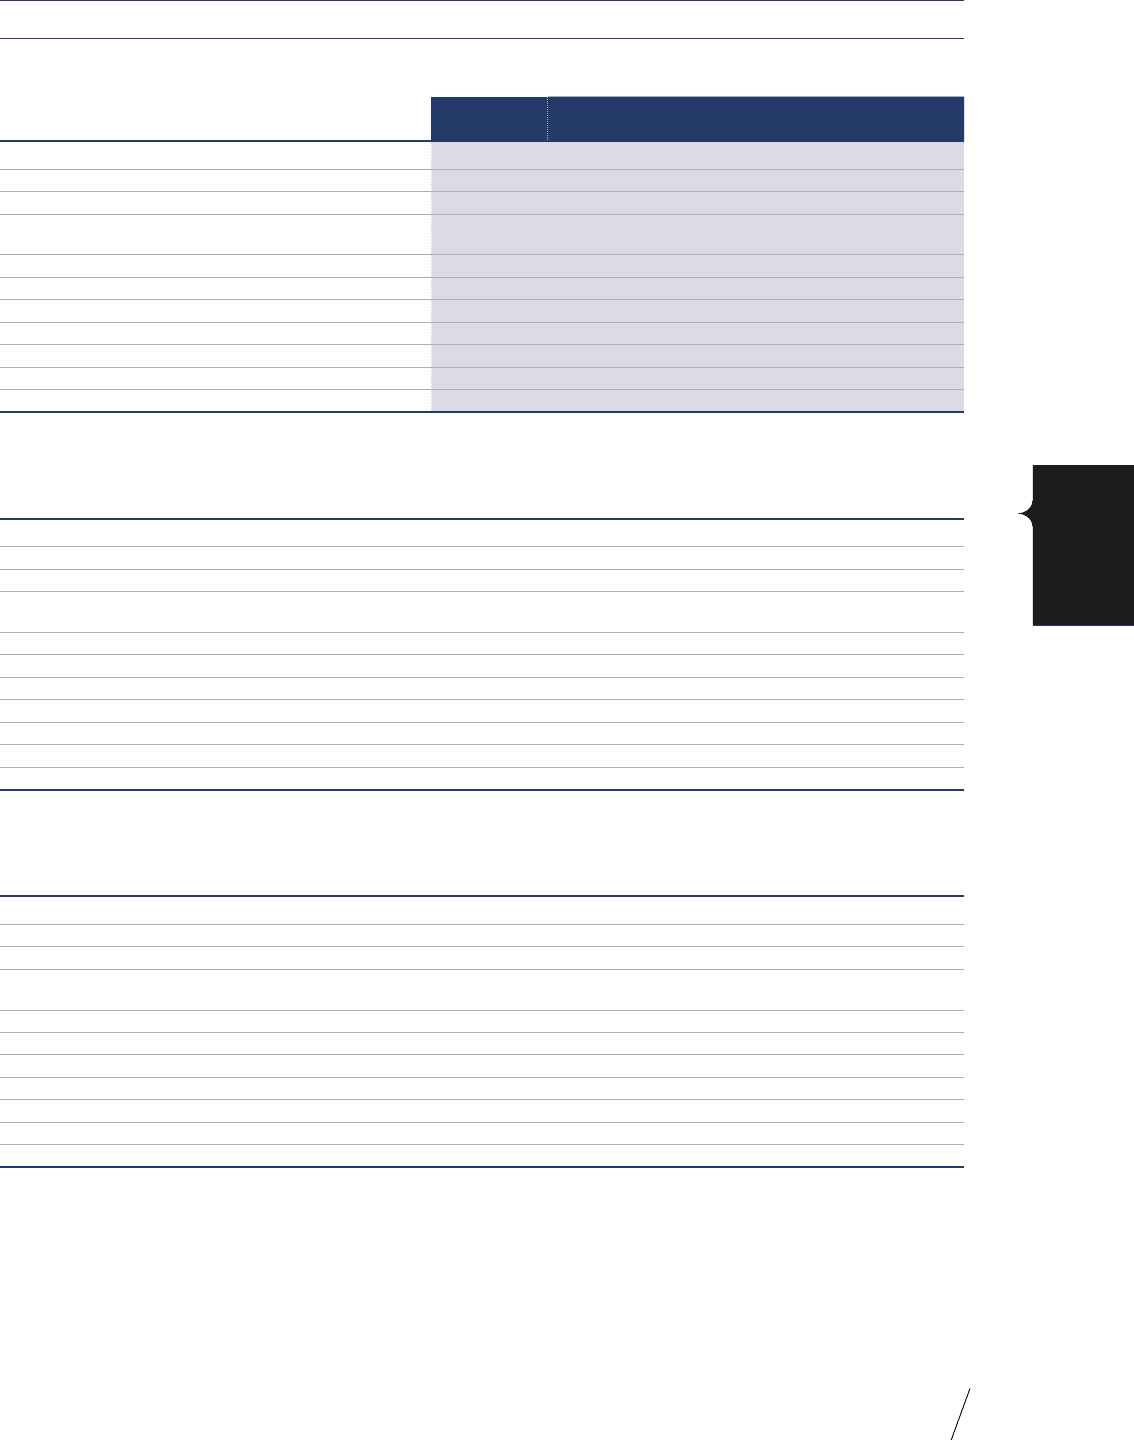
NOTE14 Property, plant and equipment
€ millions
2011 12.31.2010
Acquisitions/
Depreciation Disposals/
Reversals Translation
difference Other
movements(1) 12.31.2011
Land and buildings 1,729.4 65.2 -35.2 2.3 127.1 1,888.8
Machinery and equipment 2,585.3 156.9 -78.7 -1.6 85.2 2,747.1
Point-of-sales advertising: stands and displays 1,161.0 245.7 -191.5 18.5 11.7 1,245.4
Other property, plant and equipment and
fixed assets in progress 1,337.5 287.7 -64.4 19.2 -154.3 1,425.7
Gross value 6,813.2 755.5 -369.8 38.4 69.7 7,307.0
Land and buildings 924.8 68.2 -28.3 2.8 11.6 979.1
Machinery and equipment 1,725.2 209.3 -75.8 2.6 2.7 1,864.0
Point-of-sales advertising: stands and displays 797.9 223.1 -190.5 10.8 1.3 842.6
Other 687.8 107.1 -63.4 12.6 -3.5 740.5
Depreciation and provisions 4,135.7 607.7 -358.0 28.8 12.1 4,426.2
P roperty, plant and equipment - net 2,677.5 147.7 -11.8 9.6 57.7 2,880.8
(1) These mainly include the impact of changes in the scope of consolidation and fixed assets in progress allocated to other fixed asset items.
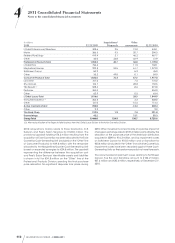
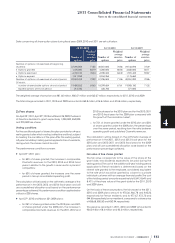
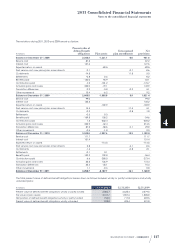
€ millions
2010 12.31.2009
Acquisitions/
Depreciation
Disposals/
Reversals
Translation
difference
Other
movements(1) 12.31.2010
Land and buildings 1,663.7 43.3 -38.5 54.2 6.7 1,729.4
Machinery and equipment 2,495.1 100.7 -139.3 91.5 37.3 2,585.3
Point-of-sales advertising: stands and displays 1,080.7 197.0 -207.9 75.5 15.7 1,161.0
Other property, plant and equipment and
fixed assets in progress 1,164.1 257.0 -44.9 71.6 -110.3 1,337.5
Gross value 6,403.6 598.0 -430.6 292.8 -50.6 6,813.2
Land and buildings 871.6 68.0 -29.6 21.7 -6.9 924.8
Machinery and equipment 1,617.6 223.1 -132.9 50.8 -33.4 1,725.2
Point-of-sales advertising: stands and displays 718.6 236.9 -207.6 51.0 -1.0 797.9
Property, plant and equipment 596.8 109.4 -42.6 33.7 -9.5 687.8
Depreciation and provisions 3,804.6 637.4 -412.7 157.2 -50.8 4,135.7
Property, plant and equipment - net 2,599.0 -39.4 -17.8 135.6 0.2 2,677.5
(1) These mainly include the impact of changes in the scope of consolidation and fixed assets in progress allocated to other fixed asset items.
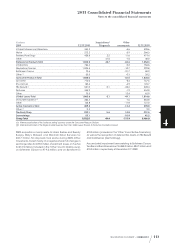
€ millions
2009 12.31.2008
Acquisitions/
Depreciation
Disposals/
Reversals
Translation
difference
Other
movements(1) 12.31.2009
Land and buildings 1,608.5 34.1 -45.3 14.2 52.2 1,663.7
Machinery and equipment 2,459.8 115.3 -141.5 12.3 49.2 2,495.1
Point-of-sales advertising: stands and displays 1,081.5 151.4 -163.9 6.3 5.4 1,080.7
Other property, plant and equipment and
fixed assets in progress 1,161.4 216.6 -76.8 -3.8 -133.3 1,164.1
Gross value 6,311.2 517.4 -427.5 29.0 -26.5 6,403.6
Land and buildings 819.8 75.5 -26.3 5.8 -3.2 871.6
Machinery and equipment 1,525.5 242.6 -137.0 5.5 -19.0 1,617.6
Point-of-sales advertising: stands and displays 637.3 233.5 -161.2 3.2 5.9 718.6
Other property, plant and equipment 575.4 114.8 -74.5 -0.5 -18.4 596.8
Depreciation and provisions 3,557.9 666.4 -399.0 14.0 -34.7 3,804.6
Property, plant and equipment - net 2,753.3 -149.0 -28.5 15.0 8.2 2,599.0
(1) These mainly include the impact of changes in the scope of consolidation and fixed assets in progress allocated to other fixed asset items.