Loreal 2011 Annual Report Download - page 124
Download and view the complete annual report
Please find page 124 of the 2011 Loreal annual report below. You can navigate through the pages in the report by either clicking on the pages listed below, or by using the keyword search tool below to find specific information within the annual report.-
 1
1 -
2
-
3
-
4
-
5
-
6
-
7
-
8
-
9
-
10
-
11
-
12
-
13
-
14
-
15
-
16
-
17
-
18
-
19
-
20
-
21
-
22
-
23
-
24
-
25
-
26
-
27
-
28
-
29
-
30
-
31
-
32
-
33
-
34
-
35
-
36
-
37
-
38
-
39
-
40
-
41
-
42
-
43
-
44
-
45
-
46
-
47
-
48
-
49
-
50
-
51
-
52
-
53
-
54
-
55
-
56
-
57
-
58
-
59
-
60
-
61
-
62
-
63
-
64
-
65
-
66
-
67
-
68
-
69
-
70
-
71
-
72
-
73
-
74
-
75
-
76
-
77
-
78
-
79
-
80
-
81
-
82
-
83
-
84
-
85
-
86
-
87
-
88
-
89
-
90
-
91
-
92
-
93
-
94
-
95
-
96
-
97
-
98
-
99
-
100
-
101
-
102
-
103
-
104
-
105
-
106
-
107
-
108
-
109
-
110
-
111
-
112
-
113
-
 114
114 -
 115
115 -
 116
116 -
 117
117 -
 118
118 -
 119
119 -
 120
120 -
 121
121 -
 122
122 -
 123
123 -
 124
124 -
 125
125 -
 126
126 -
 127
127 -
 128
128 -
 129
129 -
 130
130 -
 131
131 -
 132
132 -
 133
133 -
 134
134 -
135
-
136
-
137
-
138
-
139
-
140
-
141
-
142
-
143
-
144
-
145
-
146
-
147
-
148
-
149
-
150
-
151
-
152
-
153
-
154
-
155
-
156
-
157
-
158
-
159
-
160
-
161
-
162
-
163
-
164
-
165
-
166
-
167
-
168
-
169
-
170
-
171
-
172
-
173
-
174
-
175
-
176
-
177
-
178
-
179
-
180
-
181
-
182
-
183
-
184
-
185
-
186
-
187
-
188
-
189
-
190
-
191
-
192
-
193
-
194
-
195
-
196
-
197
-
198
-
199
-
200
-
201
-
202
-
203
-
204
-
205
-
206
-
207
-
208
-
209
-
210
-
211
-
212
-
213
-
214
-
215
-
216
-
217
-
218
-
219
-
220
-
221
-
222
-
223
-
224
-
225
-
226
-
227
-
228
-
229
-
230
-
231
-
232
-
233
-
234
-
235
-
236
-
237
-
238
-
239
-
240
-
241
-
242
-
243
-
244
-
245
-
246
 |
 |

122 REGISTRATION DOCUMENT − L’ORÉAL 2011
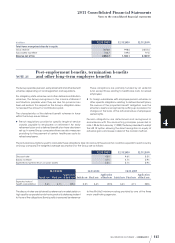
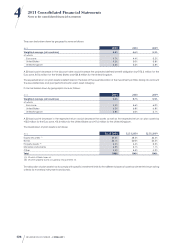
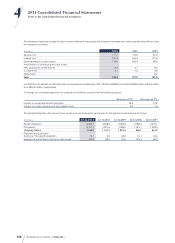
42011 Consolidated Financial Statements
Notes to the consolidated nancial statements
All plans have a 5-year exercise period and no performance-
related conditions, except the April22nd, 2011 plan (for all
participants) and the April27th, 2010 and March25th, 2009
plans (for members of the Management Committee). The
performance conditions associated with these plans concern:
♦April22nd, 2011 plan:
− for 50% of options granted, the increase in comparable
Cosmetic revenues for the 2012, 2013, 2014 and 2015 fiscal
years in relation to the growth in revenues for a panel of
competitors;
− for 50% of options granted, the increase over the same
period in Group consolidated operating profit.
The calculation will be based on the arithmetic average of the
performance in2012, 2013, 2014 and 2015 fiscal years and will
use a predefined allocation scale based on the performance
percentage reached.
♦April27th, 2010 and March25th, 2009 plans:
− for 50% of options granted, the increase in comparable
Cosmetic revenues for the 2011, 2012, 2013 and 2014
fiscal years for the 2010 plan and for the 2010, 2011, 2012
and2013 fiscal years for the 2009 plan compared to the
growth of the cosmetics market;
− for 50% of shares granted, the percentage, over the same
period, resulting from the ratio between the contribution
before advertising and promotion expenses,
i.e.
the
sum of operating profit and advertising and promotion
expenses, and published Cosmetic revenues.
The calculation will be based on the arithmetic average of
performance in the 2011, 2012, 2013 and 2014 fiscal years for
the 2010 plan and in the 2010, 2011, 2012 and2013 fiscal years
for the 2009 plan, and will use a predefined allocation scale
based on the performance percentage achieved.
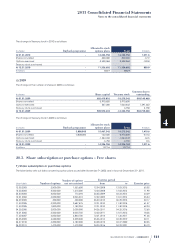
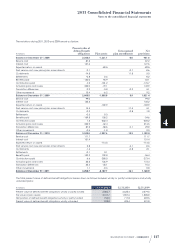
The fair value of options is determined using the Black&Scholes method based on the following assumptions:
Purchase options Subscription options
December
2003
November
2005
December
2003
March
2004
December
2004
June
2005
November
2005
April
2006
December
2006
November
2007
March
2009
April
2010
April
2011
Risk-free rate
of return 4.22% 3.16% 3.92% 3.39% 3.17% 2.63% 3.16% 3.80% 3.62% 4.01% 3.15% 2.83% 3.42%
Expected life
span 8years 6years 6years 7years 6years 6years 6years 6years 7years 7years 7years 7years 8years
Expected
volatility 21.50% 21.00% 21.50% 23.67% 18.70% 17.00% 21.00% 20.50% 22.52% 23.00% 31.95% 23.53% 22.60%
Expected
dividends 1.00% 1.35% 1.00% 1.20% 1.34% 1.38% 1.35% 1.35% 1.35% 1.24% 2.83% 1.86% 2.10%
Share price €63.45 €61.30 €63.45 €60.60 €54.60 €59.40 €61.30 €74.10 €74.60 €94.93 €50.94 €80.50 €85.68
Exercise
price €71.90 €62.94 €63.02 €64.69 €55.54 €60.17 €61.37 €72.60 €78.06 €91.66 €50.11 €80.03 €83.19
Fair value €15.24 €12.30 €15.66 €14.67 €10.15 €9.45 €12.88 €17.48 €17.19 €25.88 €12.16 €17.17 €18.58
Expected volatility is equal to the implied volatility of the options
listed on MONEP at the grant dates. As from2007, in order to
mitigate the effects of atypical phenomena, the volatility
used corresponds to the average between implied volatility
at the grant date and historic volatility over the expected life
span of the option. The expected life span has been adjusted
to take account of behavioural assumptions relating to the
beneficiaries.