Loreal 2011 Annual Report Download - page 222
Download and view the complete annual report
Please find page 222 of the 2011 Loreal annual report below. You can navigate through the pages in the report by either clicking on the pages listed below, or by using the keyword search tool below to find specific information within the annual report.-
 1
1 -
2
-
3
-
4
-
5
-
6
-
7
-
8
-
9
-
10
-
11
-
12
-
13
-
14
-
15
-
16
-
17
-
18
-
19
-
20
-
21
-
22
-
23
-
24
-
25
-
26
-
27
-
28
-
29
-
30
-
31
-
32
-
33
-
34
-
35
-
36
-
37
-
38
-
39
-
40
-
41
-
42
-
43
-
44
-
45
-
46
-
47
-
48
-
49
-
50
-
51
-
52
-
53
-
54
-
55
-
56
-
57
-
58
-
59
-
60
-
61
-
62
-
63
-
64
-
65
-
66
-
67
-
68
-
69
-
70
-
71
-
72
-
73
-
74
-
75
-
76
-
77
-
78
-
79
-
80
-
81
-
82
-
83
-
84
-
85
-
86
-
87
-
88
-
89
-
90
-
91
-
92
-
93
-
94
-
95
-
96
-
97
-
98
-
99
-
100
-
101
-
102
-
103
-
104
-
105
-
106
-
107
-
108
-
109
-
110
-
111
-
112
-
113
-
114
-
115
-
116
-
117
-
118
-
119
-
120
-
121
-
122
-
123
-
124
-
125
-
126
-
127
-
128
-
129
-
130
-
131
-
132
-
133
-
134
-
135
-
136
-
137
-
138
-
139
-
140
-
141
-
142
-
143
-
144
-
145
-
146
-
147
-
148
-
149
-
150
-
151
-
152
-
153
-
154
-
155
-
156
-
157
-
158
-
159
-
160
-
161
-
162
-
163
-
164
-
165
-
166
-
167
-
168
-
169
-
170
-
171
-
172
-
173
-
174
-
175
-
176
-
177
-
178
-
179
-
180
-
181
-
182
-
183
-
184
-
185
-
186
-
187
-
188
-
189
-
190
-
191
-
192
-
193
-
194
-
195
-
196
-
197
-
198
-
199
-
200
-
201
-
202
-
203
-
204
-
205
-
206
-
207
-
208
-
209
-
210
-
211
-
 212
212 -
 213
213 -
 214
214 -
 215
215 -
 216
216 -
 217
217 -
 218
218 -
 219
219 -
 220
220 -
 221
221 -
 222
222 -
 223
223 -
 224
224 -
 225
225 -
 226
226 -
 227
227 -
 228
228 -
 229
229 -
 230
230 -
 231
231 -
 232
232 -
233
-
234
-
235
-
236
-
237
-
238
-
239
-
240
-
241
-
242
-
243
-
244
-
245
-
246
 |
 |

220 REGISTRATION DOCUMENT − L’ORÉAL 2011
7Stock market information andsharecapital
L’Oréal share market
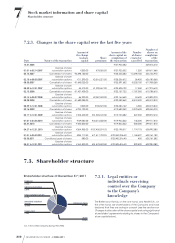
7.4.2. L’Oréal share market
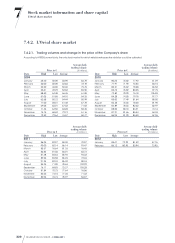
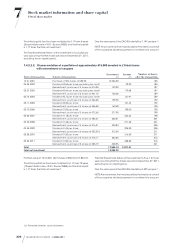
7.4.2.1. Trading volumes and change intheprice oftheCompany’s share
According to NYSE-Euronext data, the only stock market for which reliable retrospective statistics could be collected.
Date
Price in €
Average daily
trading volume
(€ millions)
High Low Average
2009
January 65.40 50.00 56.95 83.78
February 56.00 50.00 52.66 72.18
March 52.50 46.00 50.30 75.75
April 55.61 49.29 52.62 83.90
May 58.50 54.48 56.45 61.83
June 57.05 51.85 54.10 54.33
July 62.68 50.72 54.44 50.99
August 71.00 58.51 61.48 67.78
September 69.05 65.01 67.52 71.02
October 71.46 64.50 68.28 58.35
November 74.75 68.69 72.19 61.16
December 79.32 72.64 76.37 60.77
Date
Price in €
Average daily
trading volume
(€ millions)
High Low Average
2010
January 80.22 75.60 77.92 61.59
February 77.97 71.90 75.53 84.15
March 80.51 76.62 78.68 66.52
April 83.76 76.82 80.25 97.75
May 79.50 70.90 75.18 126.83
June 84.28 74.50 79.78 97.77
July 85.00 77.49 81.64 85.50
August 83.38 75.03 78.48 81.90
September 84.89 78.53 82.62 82.97
October 88.00 80.10 83.91 74.16
November 87.91 81.66 85.34 54.33
December 86.93 81.90 85.40 57.26
Date
Price in €
Average daily
trading volume
(€ millions )
High Low Average
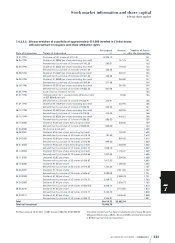
2011
January 86.95 82.27 84.30 70.07
February 90.00 82.14 86.14 93.47
March 85.37 76.64 81.33 76.43
April 86.83 81.56 84.01 65.73
May 87.48 84.64 85.93 93.32
June 89.56 83.58 86.23 72.33
July 91.24 82.10 86.32 80.18
August 84.95 71.00 78.63 102.92
September 76.17 68.83 73.27 105.28
October 81.84 70.73 77.64 76.56
November 80.32 74.15 77.35 71.32
December 80.96 76.73 78.97 56.07
Date
Price in €
Average daily
trading volume
(€ millions)
High Low Average
2012
January 83.47 79.22 81.39 57.75
February 86.12 80.9 3 83.94 73.93