Loreal 2011 Annual Report Download - page 18
Download and view the complete annual report
Please find page 18 of the 2011 Loreal annual report below. You can navigate through the pages in the report by either clicking on the pages listed below, or by using the keyword search tool below to find specific information within the annual report.-
 1
1 -
2
-
3
-
4
-
5
-
6
-
7
-
 8
8 -
 9
9 -
 10
10 -
 11
11 -
 12
12 -
 13
13 -
 14
14 -
 15
15 -
 16
16 -
 17
17 -
 18
18 -
 19
19 -
 20
20 -
 21
21 -
 22
22 -
 23
23 -
 24
24 -
 25
25 -
 26
26 -
 27
27 -
 28
28 -
29
-
30
-
31
-
32
-
33
-
34
-
35
-
36
-
37
-
38
-
39
-
40
-
41
-
42
-
43
-
44
-
45
-
46
-
47
-
48
-
49
-
50
-
51
-
52
-
53
-
54
-
55
-
56
-
57
-
58
-
59
-
60
-
61
-
62
-
63
-
64
-
65
-
66
-
67
-
68
-
69
-
70
-
71
-
72
-
73
-
74
-
75
-
76
-
77
-
78
-
79
-
80
-
81
-
82
-
83
-
84
-
85
-
86
-
87
-
88
-
89
-
90
-
91
-
92
-
93
-
94
-
95
-
96
-
97
-
98
-
99
-
100
-
101
-
102
-
103
-
104
-
105
-
106
-
107
-
108
-
109
-
110
-
111
-
112
-
113
-
114
-
115
-
116
-
117
-
118
-
119
-
120
-
121
-
122
-
123
-
124
-
125
-
126
-
127
-
128
-
129
-
130
-
131
-
132
-
133
-
134
-
135
-
136
-
137
-
138
-
139
-
140
-
141
-
142
-
143
-
144
-
145
-
146
-
147
-
148
-
149
-
150
-
151
-
152
-
153
-
154
-
155
-
156
-
157
-
158
-
159
-
160
-
161
-
162
-
163
-
164
-
165
-
166
-
167
-
168
-
169
-
170
-
171
-
172
-
173
-
174
-
175
-
176
-
177
-
178
-
179
-
180
-
181
-
182
-
183
-
184
-
185
-
186
-
187
-
188
-
189
-
190
-
191
-
192
-
193
-
194
-
195
-
196
-
197
-
198
-
199
-
200
-
201
-
202
-
203
-
204
-
205
-
206
-
207
-
208
-
209
-
210
-
211
-
212
-
213
-
214
-
215
-
216
-
217
-
218
-
219
-
220
-
221
-
222
-
223
-
224
-
225
-
226
-
227
-
228
-
229
-
230
-
231
-
232
-
233
-
234
-
235
-
236
-
237
-
238
-
239
-
240
-
241
-
242
-
243
-
244
-
245
-
246
 |
 |
16 REGISTRATION DOCUMENT − L’ORÉAL 2011
1Presentation oftheGroup
Operations
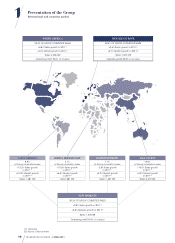
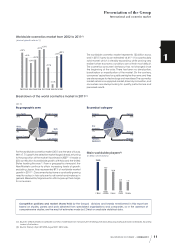
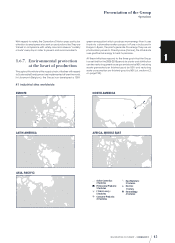
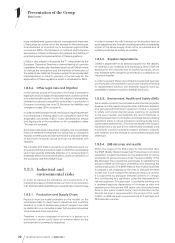
Producing and consuming locally
The Group’s plants are spread out all over the world in order
to fulfil a very simple objective: to reduce as much as possible
the distance between consumers and the production zones .
The Group’s 41plants are located in areas enabling a rapid
supply of all the countries in which the Group is present. The
strong growth of products in the Consumer Products Division ,
particularly in the New Markets, accounts for the number and
geographical breakdown of this Division’s plants. Furthermore,
in order to support the conquest of the next billion consumers
in the emerging markets, the Group launched a new plant in
Russia in2011. In2012, three other sites are scheduled to open
in Mexico, Indonesia and Egypt.
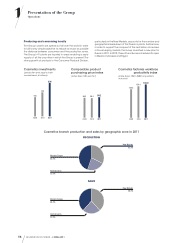
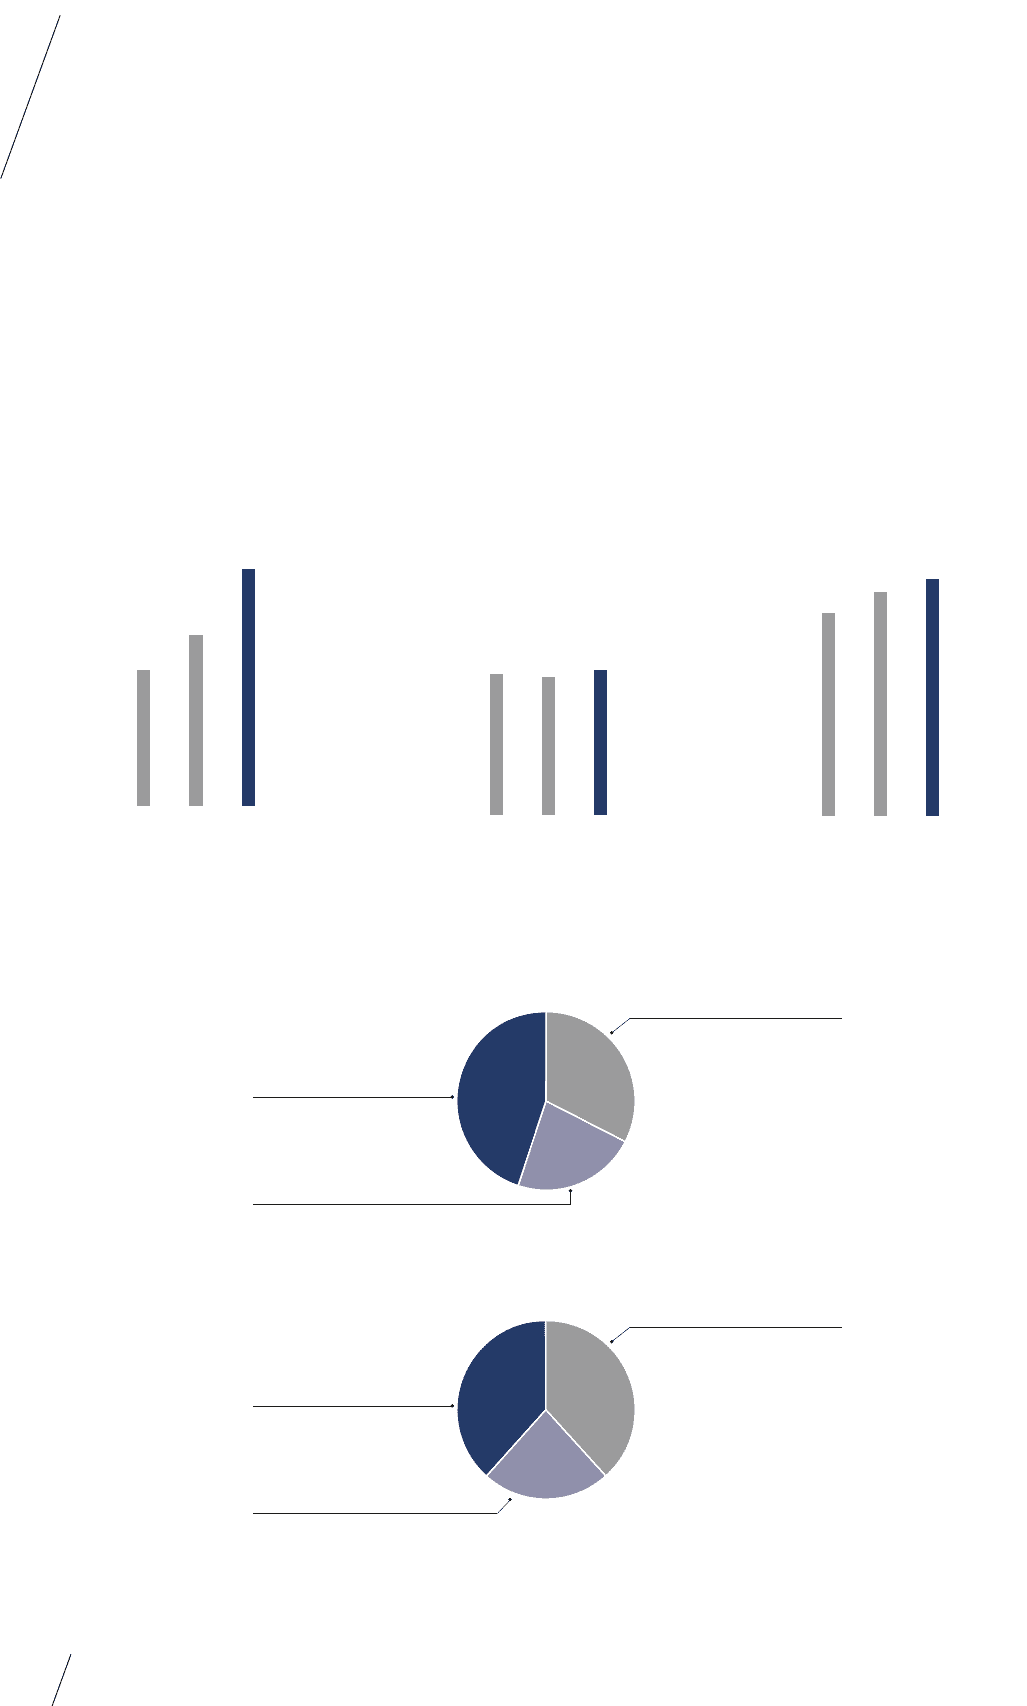
Cosmetics investments
(production and supply chain
commitments, € millions)
235
188
2009 2010 2011
326
Comparable product
purchasing price index
(index base 100: year N-1)
95.496.3
2009 2010 2011
99.2
Cosmetics factories workforce
productivity index
(index base: 100 in2002, acquisitions
included)
154.0
139.5
2009 2010 2011
163.0
Cosmetics branch production and sales by geographic zone in2011
PRODUCTION
45.2%
Western Europe
32.3%
New Markets
22.5%
North America
SALES
38.4%
Western Europe
38.3%
New Markets
23.3%
North America