Loreal 2011 Annual Report Download - page 129
Download and view the complete annual report
Please find page 129 of the 2011 Loreal annual report below. You can navigate through the pages in the report by either clicking on the pages listed below, or by using the keyword search tool below to find specific information within the annual report.-
 1
1 -
2
-
3
-
4
-
5
-
6
-
7
-
8
-
9
-
10
-
11
-
12
-
13
-
14
-
15
-
16
-
17
-
18
-
19
-
20
-
21
-
22
-
23
-
24
-
25
-
26
-
27
-
28
-
29
-
30
-
31
-
32
-
33
-
34
-
35
-
36
-
37
-
38
-
39
-
40
-
41
-
42
-
43
-
44
-
45
-
46
-
47
-
48
-
49
-
50
-
51
-
52
-
53
-
54
-
55
-
56
-
57
-
58
-
59
-
60
-
61
-
62
-
63
-
64
-
65
-
66
-
67
-
68
-
69
-
70
-
71
-
72
-
73
-
74
-
75
-
76
-
77
-
78
-
79
-
80
-
81
-
82
-
83
-
84
-
85
-
86
-
87
-
88
-
89
-
90
-
91
-
92
-
93
-
94
-
95
-
96
-
97
-
98
-
99
-
100
-
101
-
102
-
103
-
104
-
105
-
106
-
107
-
108
-
109
-
110
-
111
-
112
-
113
-
114
-
115
-
116
-
117
-
118
-
 119
119 -
 120
120 -
 121
121 -
 122
122 -
 123
123 -
 124
124 -
 125
125 -
 126
126 -
 127
127 -
 128
128 -
 129
129 -
 130
130 -
 131
131 -
 132
132 -
 133
133 -
 134
134 -
 135
135 -
 136
136 -
 137
137 -
 138
138 -
 139
139 -
140
-
141
-
142
-
143
-
144
-
145
-
146
-
147
-
148
-
149
-
150
-
151
-
152
-
153
-
154
-
155
-
156
-
157
-
158
-
159
-
160
-
161
-
162
-
163
-
164
-
165
-
166
-
167
-
168
-
169
-
170
-
171
-
172
-
173
-
174
-
175
-
176
-
177
-
178
-
179
-
180
-
181
-
182
-
183
-
184
-
185
-
186
-
187
-
188
-
189
-
190
-
191
-
192
-
193
-
194
-
195
-
196
-
197
-
198
-
199
-
200
-
201
-
202
-
203
-
204
-
205
-
206
-
207
-
208
-
209
-
210
-
211
-
212
-
213
-
214
-
215
-
216
-
217
-
218
-
219
-
220
-
221
-
222
-
223
-
224
-
225
-
226
-
227
-
228
-
229
-
230
-
231
-
232
-
233
-
234
-
235
-
236
-
237
-
238
-
239
-
240
-
241
-
242
-
243
-
244
-
245
-
246
 |
 |
127REGISTRATION DOCUMENT − L’ORÉAL 2011
2011 Consolidated Financial Statements
4
Notes to the consolidated nancial statements
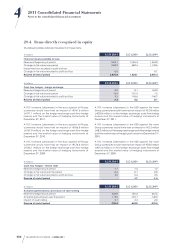
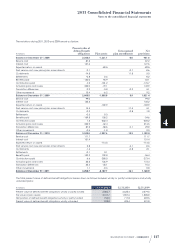
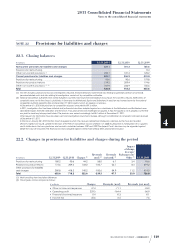
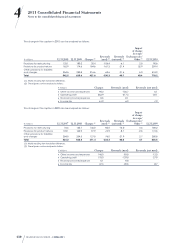
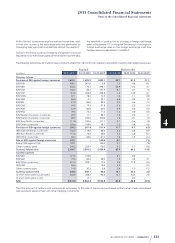
The variations during 2011, 2010 and2009 are set out below:
€ millions
Present value of
defined benefit
obligations Plan assets
Unrecognised
plan amendments
Net
provisions
Balance at December31st, 2008 2,288.4 -1,321.7 -5.0 961.6
Service cost 87.2 87.2
Interest cost 127.6 127.6
Expected return on assets -89.5 -89.5
Past service cost: new plans/plan amendments 0.1 -0.7 -0.6
Curtailments -14.8 11.8 -3.0
Settlements -0.8 0.6 -0.2
Benefits paid -130.0 95.9 -34.1
Contributions paid 4.5 -181.2 -176.7
Actuarial gains and losses 222.0 -79.1 142.9
Translation differences 0.9 -3.8 -0.2 -3.1
Other movements 15.4 -6.2 9.2
Balance at December31st, 2009 2,600.5 -1,585.0 5.9 1,021.4
Service cost 99.0 99.0
Interest cost 135.2 135.2
Expected return on assets -102.9 -102.9
Past service cost: new plans/plan amendments 14.3 -17.4 -3.1
Curtailments -0.2 -0.8 -1.0
Settlements -0.3 0.3 -
Benefits paid -139.8 105.2 -34.6
Contributions paid 7.2 -232.4 -225.2
Actuarial gains and losses 245.9 -32.4 213.5
Translation differences 87.5 -58.6 0.1 29.0
Other movements -0.5 -1.8 -2.3
Balance at December31st, 2010 3,048.8 -1,907.6 -12.2 1,129.0
Service cost 111.7 111.7
Interest cost 131.4 131.4
Expected return on assets -114.5 -114.5
Past service cost: new plans/plan amendments 2.8 -3.1 -0.3
Curtailments -1.3 -0.8 -2.1
Settlements -0.1 0.1 -
Benefits paid -139.2 102.8 -36.4
Contributions paid 6.6 -280.0 -273.4
Actuarial gains and losses 45.5 126.9 172.4
Translation differences 45.4 -35.1 10.3
Other movements 1.1 -0.3 0.8
Balance at December31st, 2011 3,252.7 -2,107.7 -16.1 1,128.9
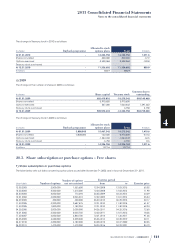
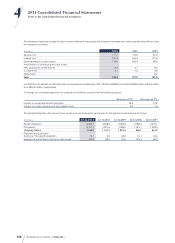
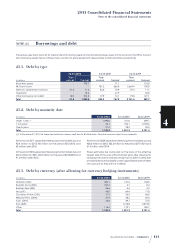
The total present value of defined benefit obligations breaks down as follows between wholly or partly funded plans and wholly
unfunded plans:
€ millions
12.31.2011 12.31.2010 12.31.2009
Present value of defined benefit obligations wholly or partly funded 2,860.7 2,625.4 2,279.5
Fair value of plan assets 2,107.7 1,907.6 1,585.0
Net position of defined benefit obligations wholly or partly funded 753.0 717.8 694.5
Present value of defined benefit obligations wholly unfunded 392.0 423.4 321.0