Loreal 2011 Annual Report Download - page 105
Download and view the complete annual report
Please find page 105 of the 2011 Loreal annual report below. You can navigate through the pages in the report by either clicking on the pages listed below, or by using the keyword search tool below to find specific information within the annual report.-
 1
1 -
2
-
3
-
4
-
5
-
6
-
7
-
8
-
9
-
10
-
11
-
12
-
13
-
14
-
15
-
16
-
17
-
18
-
19
-
20
-
21
-
22
-
23
-
24
-
25
-
26
-
27
-
28
-
29
-
30
-
31
-
32
-
33
-
34
-
35
-
36
-
37
-
38
-
39
-
40
-
41
-
42
-
43
-
44
-
45
-
46
-
47
-
48
-
49
-
50
-
51
-
52
-
53
-
54
-
55
-
56
-
57
-
58
-
59
-
60
-
61
-
62
-
63
-
64
-
65
-
66
-
67
-
68
-
69
-
70
-
71
-
72
-
73
-
74
-
75
-
76
-
77
-
78
-
79
-
80
-
81
-
82
-
83
-
84
-
85
-
86
-
87
-
88
-
89
-
90
-
91
-
92
-
93
-
94
-
 95
95 -
 96
96 -
 97
97 -
 98
98 -
 99
99 -
 100
100 -
 101
101 -
 102
102 -
 103
103 -
 104
104 -
 105
105 -
 106
106 -
 107
107 -
 108
108 -
 109
109 -
 110
110 -
 111
111 -
 112
112 -
 113
113 -
 114
114 -
 115
115 -
116
-
117
-
118
-
119
-
120
-
121
-
122
-
123
-
124
-
125
-
126
-
127
-
128
-
129
-
130
-
131
-
132
-
133
-
134
-
135
-
136
-
137
-
138
-
139
-
140
-
141
-
142
-
143
-
144
-
145
-
146
-
147
-
148
-
149
-
150
-
151
-
152
-
153
-
154
-
155
-
156
-
157
-
158
-
159
-
160
-
161
-
162
-
163
-
164
-
165
-
166
-
167
-
168
-
169
-
170
-
171
-
172
-
173
-
174
-
175
-
176
-
177
-
178
-
179
-
180
-
181
-
182
-
183
-
184
-
185
-
186
-
187
-
188
-
189
-
190
-
191
-
192
-
193
-
194
-
195
-
196
-
197
-
198
-
199
-
200
-
201
-
202
-
203
-
204
-
205
-
206
-
207
-
208
-
209
-
210
-
211
-
212
-
213
-
214
-
215
-
216
-
217
-
218
-
219
-
220
-
221
-
222
-
223
-
224
-
225
-
226
-
227
-
228
-
229
-
230
-
231
-
232
-
233
-
234
-
235
-
236
-
237
-
238
-
239
-
240
-
241
-
242
-
243
-
244
-
245
-
246
 |
 |
103REGISTRATION DOCUMENT − L’ORÉAL 2011
2011 Consolidated Financial Statements
4
Notes to the consolidated nancial statements
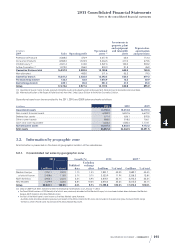
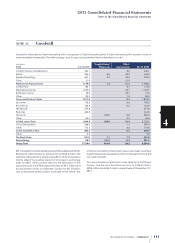
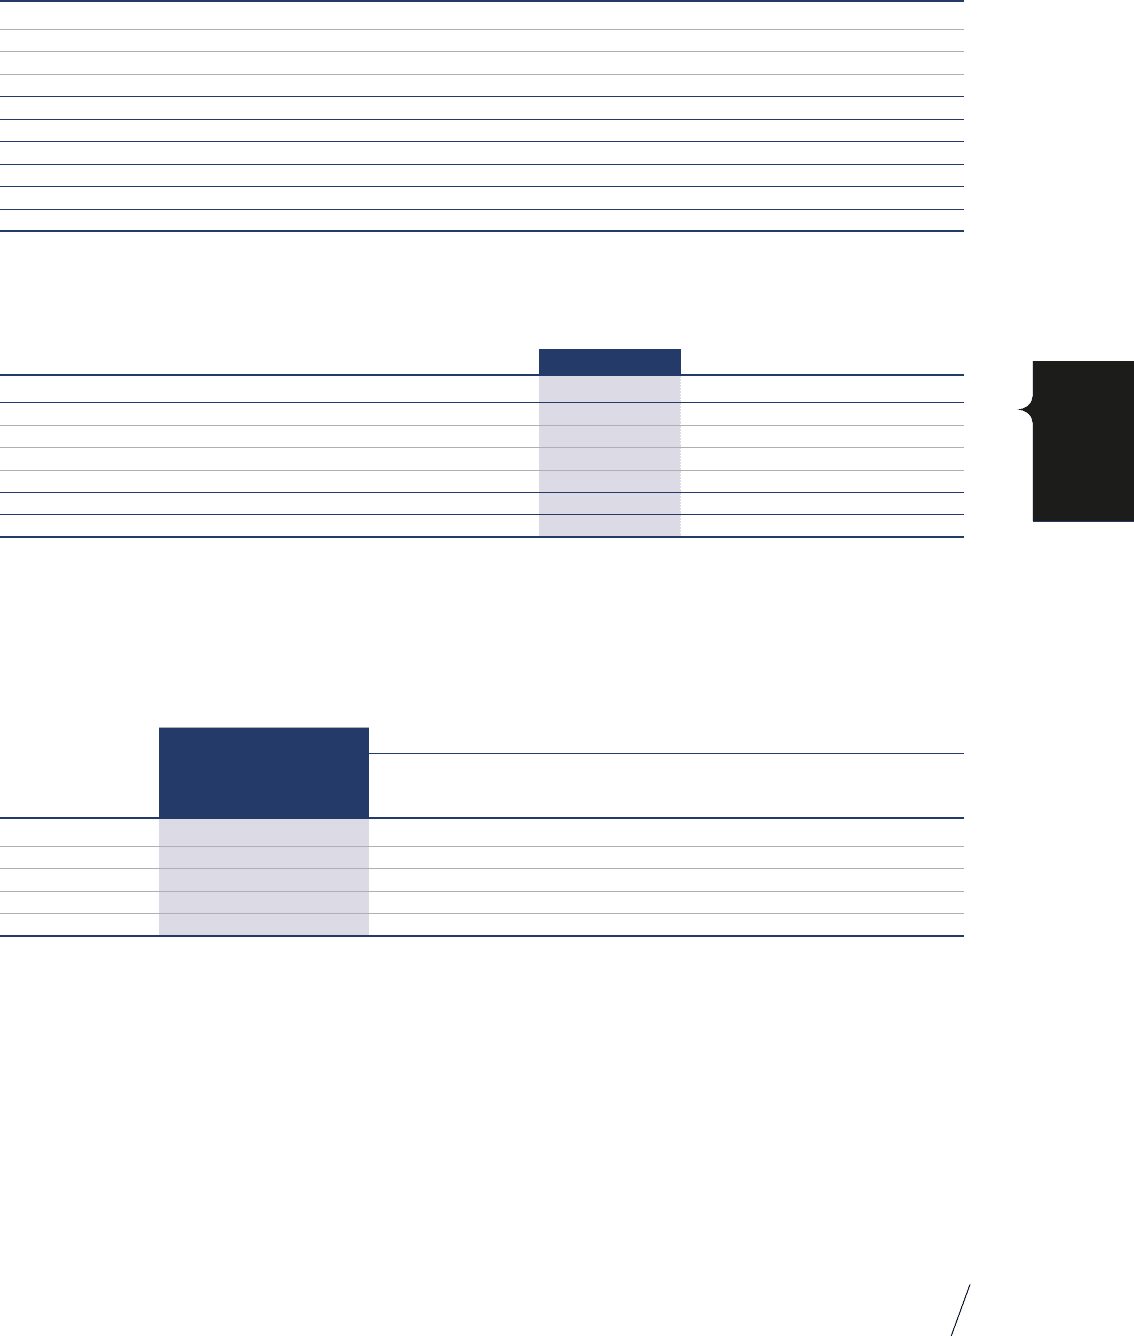
€ millions
2009 Sales Operating profit
Operational
assets(1)
Investments in
property, plant
and equipment
and intangible
assets
Depreciation,
amortisation
and provisions
Professional Products 2,388.5 476.9 2,417.8 60.4 112.4
Consumer Products 8,555.2 1,576.9 5,364.5 317.0 379.5
L’Oréal Luxury(2) 4,041.4 612.0 3,527.6 103.0 202.2
Active Cosmetics(2) 1,272.0 255.0 810.9 21.8 45.9
Cosmetics Divisions total 16,257.2 2,920.8 12,120.8 502.2 740.0
Non-allocated -482.0 371.6 53.2 79.3
Cosmetics branch 16,257.2 2,438.8 12,492.4 555.4 819.3
The Body Shop branch 726.3 53.8 1,075.9 13.5 40.9
Dermatology branch 489.1 85.0 551.0 31.9 35.8
Group 17,472.6 2,577.6 14,119.3 600.8 895.9
(1) Operational assets mainly include goodwill intangible assets and property, plant and equipment , trade accounts receivable and inventories.
(2) After reclassification of the Roger & Gallet business from the L’Oréal Luxury Division to the Active Cosmetics Division.
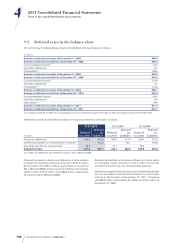
Operational assets can be reconciled to the 2011, 2010 and 2009 balance sheets as follows:
€ millions
2011 2010 2009
Operational assets 16,750.0 15,212.0 14,119.3
Non-current financial assets 6,900.9 5,837.5 6,672.2
Deferred tax assets 671.4 626.1 570.8
Other current assets 883.0 818.5 756.1
Cash and cash equivalent 1,652.2 1,550.4 1,173.1
Non-allocated assets 10,107.6 8,832.5 9,172.2
Total assets 26,857.6 24,044.5 23,291.5
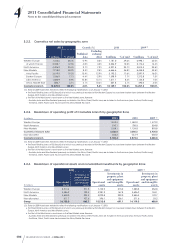
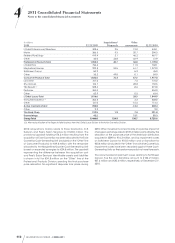
3.2. Information by geographic zone
All information is presented on the basis of geographic location of the subsidiaries.
3.2.1. Consolidated net sales by geographic zone
2011 Growth (%) 2010 2009(1)
€ millions % of total
Published
data
Excluding
exchange
effect € millions % of total € millions % of total
Western Europe 7,931.1 39.0% 1.7% 1.3% 7,801.7 40.0% 7,582.7 43.4%
of which France 2,408.6 11.8% 3.7% 3.7% 2,323.9 11.9% 2,238.2 12.8%
North America 4,932.1 24.2% 2.4% 6.9% 4,818.7 24.7% 4,274.4 24.5%
New Markets 7,479.9 36.8% 8.8% 10.0% 6,875.4 35.3% 5,615.5 32.1%
Group 20,343.1 100.0% 4.3% 5.7% 19,495.8 100.0% 17,472.6 100.0%
(1) Data for 2009 have been restated to reflect the following modifications as of January1st, 2010:
♦the Travel Retail business of YSL Beauté, all of which was previously recorded within Western Europe, has now been broken down between the Western
Europe, North America and New Markets zones;
♦the Rest of the World zone is now known as the New Markets zone. However:
- Australia, India and New Zealand, previously included in the Africa, Orient, Pacific zone, are included in the Asia zone (now the Asia, Pacific zone),
- the Africa, Orient, Pacific zone has become the Africa, Middle East zone.