Loreal 2011 Annual Report Download - page 173
Download and view the complete annual report
Please find page 173 of the 2011 Loreal annual report below. You can navigate through the pages in the report by either clicking on the pages listed below, or by using the keyword search tool below to find specific information within the annual report.-
 1
1 -
2
-
3
-
4
-
5
-
6
-
7
-
8
-
9
-
10
-
11
-
12
-
13
-
14
-
15
-
16
-
17
-
18
-
19
-
20
-
21
-
22
-
23
-
24
-
25
-
26
-
27
-
28
-
29
-
30
-
31
-
32
-
33
-
34
-
35
-
36
-
37
-
38
-
39
-
40
-
41
-
42
-
43
-
44
-
45
-
46
-
47
-
48
-
49
-
50
-
51
-
52
-
53
-
54
-
55
-
56
-
57
-
58
-
59
-
60
-
61
-
62
-
63
-
64
-
65
-
66
-
67
-
68
-
69
-
70
-
71
-
72
-
73
-
74
-
75
-
76
-
77
-
78
-
79
-
80
-
81
-
82
-
83
-
84
-
85
-
86
-
87
-
88
-
89
-
90
-
91
-
92
-
93
-
94
-
95
-
96
-
97
-
98
-
99
-
100
-
101
-
102
-
103
-
104
-
105
-
106
-
107
-
108
-
109
-
110
-
111
-
112
-
113
-
114
-
115
-
116
-
117
-
118
-
119
-
120
-
121
-
122
-
123
-
124
-
125
-
126
-
127
-
128
-
129
-
130
-
131
-
132
-
133
-
134
-
135
-
136
-
137
-
138
-
139
-
140
-
141
-
142
-
143
-
144
-
145
-
146
-
147
-
148
-
149
-
150
-
151
-
152
-
153
-
154
-
155
-
156
-
157
-
158
-
159
-
160
-
161
-
162
-
 163
163 -
 164
164 -
 165
165 -
 166
166 -
 167
167 -
 168
168 -
 169
169 -
 170
170 -
 171
171 -
 172
172 -
 173
173 -
 174
174 -
 175
175 -
 176
176 -
 177
177 -
 178
178 -
 179
179 -
 180
180 -
 181
181 -
 182
182 -
 183
183 -
184
-
185
-
186
-
187
-
188
-
189
-
190
-
191
-
192
-
193
-
194
-
195
-
196
-
197
-
198
-
199
-
200
-
201
-
202
-
203
-
204
-
205
-
206
-
207
-
208
-
209
-
210
-
211
-
212
-
213
-
214
-
215
-
216
-
217
-
218
-
219
-
220
-
221
-
222
-
223
-
224
-
225
-
226
-
227
-
228
-
229
-
230
-
231
-
232
-
233
-
234
-
235
-
236
-
237
-
238
-
239
-
240
-
241
-
242
-
243
-
244
-
245
-
246
 |
 |
171REGISTRATION DOCUMENT − L’ORÉAL 2011
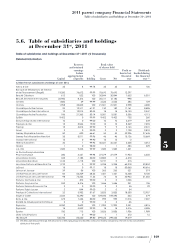
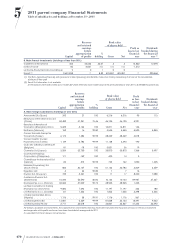
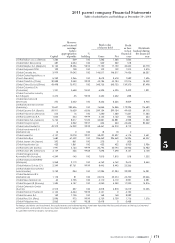
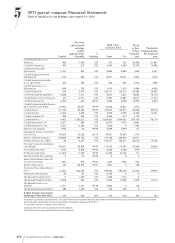
2011 parent company Financial Statements
5
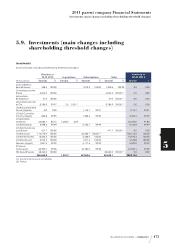
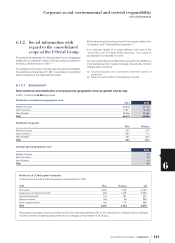
Table of subsidiaries and holdings atDecember31st, 2011
Capital
Reserves
and retained
earnings
before
appropriation
ofprofits
%
holding
Book value
of shares held Profit
or loss
in last
financial
year
Dividends
booked during
the financial
yearGross Net
L’Oréal Balkan d.o.o. (Serbia) 1,283 -309 100 1,285 1,285 1,062
L’Oréal Baltic SIA (Latvia) 387 3,054 100 529 529 518
L’Oréal Belgilux S.A. (Belgium) 16,124 18,226 98.93 77,150 77,150 30,262 30,778
L’Oréal Bulgaria EOOD 102 708 100 102 102 1,913 3,575
L’Oréal Canada Inc. 3,979 19,042 100 146,517 146,517 74,426 66,027
L’Oréal Ceska Republika s.r.o
(Czech Republic) 5,939 3,266 100 8,678 8,678 7,589 7,496
L’Oréal Chile S.A. (Chile) 20,888 9,450 99.99 43,784 43,784 27,016 15,302
L’Oréal China Co Ltd (China) 43,498 73,972 100 345,733 345,733 139,370 87,498
L’Oréal Colombia S.A.
(Colombia) 1,931 3,658 94.00 6,395 6,395 2,402 1,821
L’Oréal Cosmetics Industry
S.A.E (Egypt) 2,372 -25 99.99 2,352 2,352 -858
L’Oréal Denmark A/S
(Denmark) 270 5,642 100 8,336 8,336 8,809 8,945
L’Oréal Deutschland Gmbh
(Germany) 12,647 283,536 100 76,855 76,855 179,294 176,689
L’Oréal Espana S.A. (Spain) 59,911 16,629 63.86 299,154 299,154 49,435 69,110
L’Oréal Finland Oy (Finland) 673 16 100 1,280 1,280 11,667 11,283
L’Oréal Guatemala S.A. 1,044 544 99.99 2,162 2,162 825 334
L’Oréal Hellas S.A. (Greece) 5,736 8,017 91.82 24,881 24,881 6,998 11,940
L’Oréal Hong-Kong Ltd 3 3,562 99.97 604 604 42,666 82,602
L’Oréal India Private Ltd 49,919 -16,902 99.99 68,467 44,210 8,712
L’Oréal Investments B.V.
(Netherlands) 18 0 100 18 18 0
L’Oréal Israel Ltd 4,137 10,078 92.97 38,497 33,597 6,175 3,651
L’Oréal Italia Spa 1,680 67,402 100 226,469 226,469 76,996 63,307
L’Oréal Japan Ltd (Japan) 370 -861 100 275 0 -208
L’Oréal Kazakhstan Llp 422 1,861 100 422 422 5,930 3,906
L’Oréal Korea Ltd (Korea) 1,991 4,164 99.99 20,794 20,794 24,926 16,952
L’Oréal Liban SAL (Lebanon) 3,139 556 99.88 7,698 7,698 8,147 6,148
L’Oréal Magyarorszag
Kosmetikai Kft (Hungary) 4,249 -145 100 7,815 7,815 518 1,202
L’Oréal Malaysia SDN BHD
(Malaysia) 3,268 2,119 100 6,762 6,762 9,613 8,443
L’Oréal Mexico S. A de C. V 2,349 87,761 99.99 8,443 8,443 23,266
L’Oréal Middle East (United
Arab Emirates) 2,752 -954 100 37,284 37,284 22,222 16,981
L’Oréal Nederland B.V.
(Netherlands) 1,178 81 100 22,014 22,014 42,700 20,366
L’Oréal New Zealand Ltd 44 2,755 100 6,110 6,110 5,591 4,581
L’Oréal Norge A/S (Norway) 1,384 4,157 100 4,050 4,050 17,230 14,816
L’Oréal Osterreich Gmbh
(Austria) 2,915 897 100 3,818 3,818 12,219 12,296
L’Oréal Pakistan Private Ltd 6,142 -4,434 99.99 6,161 0 -3,192
L’Oréal Panama S.A. 159 7,705 100 168 168 8,089
L’Oréal Peru S.A. (Peru) 2,096 973 99.99 3,739 3,739 1,716 1,376
L’Oréal Philippines Inc. 2,062 -1,457 95.38 12,478 0 -2,458
For foreign subsidiaries and investments, the capital reserves and retained earnings have been translated into thousands of euros on the basis of year-end
exchange rates, while profits and losses have been translated at average rate for 2011.
It is specified that the list above is not exhaustive.