Loreal 2011 Annual Report Download - page 172
Download and view the complete annual report
Please find page 172 of the 2011 Loreal annual report below. You can navigate through the pages in the report by either clicking on the pages listed below, or by using the keyword search tool below to find specific information within the annual report.-
 1
1 -
2
-
3
-
4
-
5
-
6
-
7
-
8
-
9
-
10
-
11
-
12
-
13
-
14
-
15
-
16
-
17
-
18
-
19
-
20
-
21
-
22
-
23
-
24
-
25
-
26
-
27
-
28
-
29
-
30
-
31
-
32
-
33
-
34
-
35
-
36
-
37
-
38
-
39
-
40
-
41
-
42
-
43
-
44
-
45
-
46
-
47
-
48
-
49
-
50
-
51
-
52
-
53
-
54
-
55
-
56
-
57
-
58
-
59
-
60
-
61
-
62
-
63
-
64
-
65
-
66
-
67
-
68
-
69
-
70
-
71
-
72
-
73
-
74
-
75
-
76
-
77
-
78
-
79
-
80
-
81
-
82
-
83
-
84
-
85
-
86
-
87
-
88
-
89
-
90
-
91
-
92
-
93
-
94
-
95
-
96
-
97
-
98
-
99
-
100
-
101
-
102
-
103
-
104
-
105
-
106
-
107
-
108
-
109
-
110
-
111
-
112
-
113
-
114
-
115
-
116
-
117
-
118
-
119
-
120
-
121
-
122
-
123
-
124
-
125
-
126
-
127
-
128
-
129
-
130
-
131
-
132
-
133
-
134
-
135
-
136
-
137
-
138
-
139
-
140
-
141
-
142
-
143
-
144
-
145
-
146
-
147
-
148
-
149
-
150
-
151
-
152
-
153
-
154
-
155
-
156
-
157
-
158
-
159
-
160
-
161
-
 162
162 -
 163
163 -
 164
164 -
 165
165 -
 166
166 -
 167
167 -
 168
168 -
 169
169 -
 170
170 -
 171
171 -
 172
172 -
 173
173 -
 174
174 -
 175
175 -
 176
176 -
 177
177 -
 178
178 -
 179
179 -
 180
180 -
 181
181 -
 182
182 -
183
-
184
-
185
-
186
-
187
-
188
-
189
-
190
-
191
-
192
-
193
-
194
-
195
-
196
-
197
-
198
-
199
-
200
-
201
-
202
-
203
-
204
-
205
-
206
-
207
-
208
-
209
-
210
-
211
-
212
-
213
-
214
-
215
-
216
-
217
-
218
-
219
-
220
-
221
-
222
-
223
-
224
-
225
-
226
-
227
-
228
-
229
-
230
-
231
-
232
-
233
-
234
-
235
-
236
-
237
-
238
-
239
-
240
-
241
-
242
-
243
-
244
-
245
-
246
 |
 |
170 REGISTRATION DOCUMENT − L’ORÉAL 2011
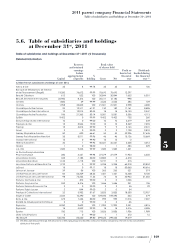
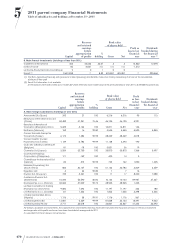
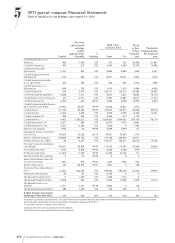
52011 parent company Financial Statements
Table of subsidiaries and holdings atDecember31st, 2011
Capital
Reserves
and retained
earnings
before
appropriation
of profits
%
holding
Book value
of shares held
Profit or
loss in last
financial
year
Dividends
booked during
the financial
year (1)
Gross Net
B. Main French investments (holdings of less than 50%)
Galderma International 462 42,626 26.67 2 2 14,862 12,094
Innéov France 80 -4,061 n/s n/s n/s -1,212
La Roche-Posay Dermato-Cosmétique 2 0 1 0 0
Sanofi(2) 2,681,838 (2) 8.82 423,887 423,887 (2) 295,568
(1) The SNCs (general partnership), GIEs (economic interest groupings) and Sociétés Civiles (non trading companies), that are not tax consolidated,
distribute all their profit.
(2) Sanofi: this information is not available.
At the balance sheet date, L’Oréal owns 118,227,307shares. Their total stock market value at the price prevailing at 12.31.2011 is 6,709,400thousand euros.
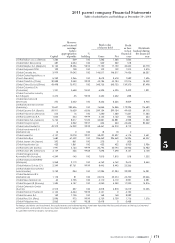
Capital
Reserves
and retained
earnings
before
appropriation
ofprofits
%
holding
Book value
of shares held Profit
or loss
in last
financial
year
Dividends
booked during
the financial
yearGross Net
A. Main foreign subsidiaries (holdings of over 50%)
Avenamite S.A. (Spain) 242 27 100 6,216 6,216 95 113
Beautycos International Co. Ltd
(China) 52,482 47,231 73.46 46,195 46,195 5,921
Beautylux International
Cosmetics (Shanghai) China 5,629 -2,134 100 16,871 16,871 136
Biotherm (Monaco) 152 16 99.80 3,545 3,545 5,520 5,835
Canan Kozmetik Sanayi Ve
Ticaret A.S. (Turkey) 6,173 7,384 99.99 28,439 28,439 3,078
Canan Tuketim Urunleri
Pazarlama A.S. (Turkey) 1,149 -2,786 99.99 11,128 4,494 -190
Club des Créateurs de Beauté
(Belgium) 81 -78 100 3,821 36 19
Cosmelor Ltd (Japan) 3,554 32,750 100 35,810 35,810 1,366 3,497
Cosmephil Holdings
Corporation (Philippines) 171 -139 100 400 14 0
Cosmétique Active Ireland Ltd
(Ireland) 82 572 99.99 732 732 1,090 1,305
Elebelle (Proprietary) Ltd
(South Africa) 806 40,107 100 61,123 46,783 3,609 3,259
Egyptelor LLC 6 64 99.80 7 7 16
Erwiton S.A. (Uruguay) 739 2,267 100 17 17 8,420 7,088
Galderma Pharma S.A.
(Switzerland) 15,694 56,590 50.00 10,124 10,124 89,981 37,367
Kosmepol Sp. z.o.o. (Poland) 38,844 27,029 99.73 48,965 48,965 1,325
Lai Mei Cosmetics Int. Trading
Shanghai Co Ltd (China) 9,500 7,693 100 11,197 11,197 336 180
L’Oréal Adria d.o.o. (Croatia) 131 1,326 100 1,503 1,503 3,398 4,346
L’Oréal Central West Africa
(Nigeria) 1,176 38 99.91 1,176 1,176 -367
L’Oréal Argentina SA 13,081 5,239 99.99 81,068 35,154 18,497 9,442
L’Oréal Australia Pty Ltd 2,711 23,018 100 33,867 33,867 41,342 36,492
For foreign subsidiaries and investments, the capital reserves and retained earnings have been translated into thousands of euros on the basis of year-end
exchange rates, while profits and losses have been translated at average rate for 2011.
It is specified that the list above is not exhaustive.