Loreal 2011 Annual Report Download - page 76
Download and view the complete annual report
Please find page 76 of the 2011 Loreal annual report below. You can navigate through the pages in the report by either clicking on the pages listed below, or by using the keyword search tool below to find specific information within the annual report.-
 1
1 -
2
-
3
-
4
-
5
-
6
-
7
-
8
-
9
-
10
-
11
-
12
-
13
-
14
-
15
-
16
-
17
-
18
-
19
-
20
-
21
-
22
-
23
-
24
-
25
-
26
-
27
-
28
-
29
-
30
-
31
-
32
-
33
-
34
-
35
-
36
-
37
-
38
-
39
-
40
-
41
-
42
-
43
-
44
-
45
-
46
-
47
-
48
-
49
-
50
-
51
-
52
-
53
-
54
-
55
-
56
-
57
-
58
-
59
-
60
-
61
-
62
-
63
-
64
-
65
-
 66
66 -
 67
67 -
 68
68 -
 69
69 -
 70
70 -
 71
71 -
 72
72 -
 73
73 -
 74
74 -
 75
75 -
 76
76 -
 77
77 -
 78
78 -
 79
79 -
 80
80 -
 81
81 -
 82
82 -
 83
83 -
 84
84 -
 85
85 -
 86
86 -
87
-
88
-
89
-
90
-
91
-
92
-
93
-
94
-
95
-
96
-
97
-
98
-
99
-
100
-
101
-
102
-
103
-
104
-
105
-
106
-
107
-
108
-
109
-
110
-
111
-
112
-
113
-
114
-
115
-
116
-
117
-
118
-
119
-
120
-
121
-
122
-
123
-
124
-
125
-
126
-
127
-
128
-
129
-
130
-
131
-
132
-
133
-
134
-
135
-
136
-
137
-
138
-
139
-
140
-
141
-
142
-
143
-
144
-
145
-
146
-
147
-
148
-
149
-
150
-
151
-
152
-
153
-
154
-
155
-
156
-
157
-
158
-
159
-
160
-
161
-
162
-
163
-
164
-
165
-
166
-
167
-
168
-
169
-
170
-
171
-
172
-
173
-
174
-
175
-
176
-
177
-
178
-
179
-
180
-
181
-
182
-
183
-
184
-
185
-
186
-
187
-
188
-
189
-
190
-
191
-
192
-
193
-
194
-
195
-
196
-
197
-
198
-
199
-
200
-
201
-
202
-
203
-
204
-
205
-
206
-
207
-
208
-
209
-
210
-
211
-
212
-
213
-
214
-
215
-
216
-
217
-
218
-
219
-
220
-
221
-
222
-
223
-
224
-
225
-
226
-
227
-
228
-
229
-
230
-
231
-
232
-
233
-
234
-
235
-
236
-
237
-
238
-
239
-
240
-
241
-
242
-
243
-
244
-
245
-
246
 |
 |

74 REGISTRATION DOCUMENT − L’ORÉAL 2011
3Comments on the2011 nancialyear
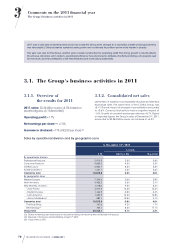
The Group's business activities in 2011
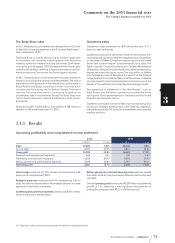
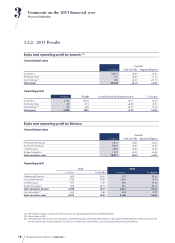
Operating profit by branch and Division
2010 2011
€ millions % sales € millions % sales
By Operational Division
Professional Products 552 20.3% 579 20.6%
Consumer Products 1,765 18.5% 1,859 18.9%
L’Oréal Luxury 791 17.5% 926 19.3%
Active Cosmetics 278 20.1% 287 20.2%
Cosmetics Divisions total 3,385 18.7% 3,651 19.3%
Non-allocated(1) -513 -2.8% -546 -2.9%
Cosmetics branch total 2,872 15.8% 3,105 16.5%
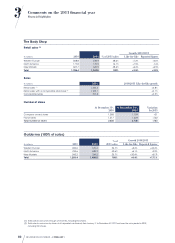
The Body Shop 65 8.7% 68 8.9%
Dermatology branch(2) 119 19.8% 120 17.0%
Group 3,057 15.7% 3,293 16.2%
(1) Non-allocated = Central group expenses, fundamental research expenses, stock options and free grant of shares expenses and miscellaneous items.
As a % of cosmetics sales.
(2) Group share, i.e. 50%.
(3) Before non-allocated.
(4) Non-recurring items i nclude mainly capital gains and losses on long-term asset disposals, impairment of long-term assets, restructuring costs and
elements relating to identified operational incomes and expenses, non-recurring and significant regarding the consolidated performance. See note 10 of
the 2011 Consolidated Financial Statement on pages 109 to 110.
(5) Diluted net earnings per share excluding non-recurring items after non-controlling interests.
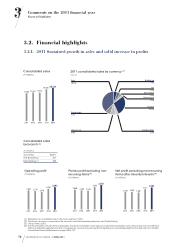
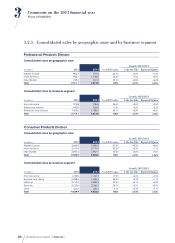
Once again this year and as in2010, all the Divisions achieved
growth in their operating profitability, particularly L’Oréal Luxury
at +180basis points.
The Body Shop improved its profitability in2011.
Finally, Galderma had to face competition from generics on two
major drugs,
Differin 0.1%
and
Loceryl
.
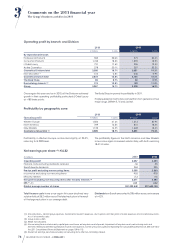
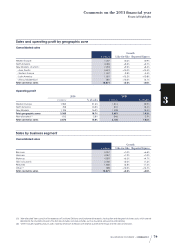
Profitability by geographic zone
Operating profit
2010 2011
€ millions
% sales
€ millions % sales
Western Europe 1,552 21.6% 1,513 20.9%
North America 709 16.5% 810 18.4%
New Markets 1,125 16.9% 1,328 18.4%
Cosmetics Zones total(3) 3,385 18.7% 3,651 19.3%
Profitability in Western Europe contracted slightly at 20.9%,
returning to its 2009 level.
The profitability figures in the North America and New Markets
zones once again increased substantially, with both reaching
18.4% of sales.
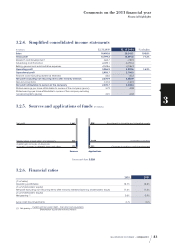
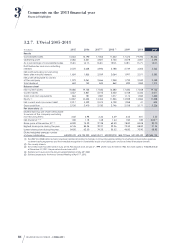
Net earnings per share(5): €4. 32
€ millions
2010 2011
Operating profit 3,057 3,293
Finance costs excluding dividends received -36 -25
Sanofi-Aventis dividends 284 295
Pre-tax profit excluding non-recurring items 3,305 3,563
Income tax excluding non-recurring items -932 -978
Minority interests -2.3 -2.5
Net profit excluding non-recurring items after minority interests(4) 2,371 2,583
EPS(5) (€) 4.01 4.32
Diluted average number of shares 591,392,449 597,633,103
Total finance costs have once again this year declined very
substantially, at 25.2million euros. This latest reduction is the result
of the large reduction in our average debt.
Dividends from Sanofi amounted to 295 million euros, an increase
of +4.2%.