Loreal 2011 Annual Report Download - page 183
Download and view the complete annual report
Please find page 183 of the 2011 Loreal annual report below. You can navigate through the pages in the report by either clicking on the pages listed below, or by using the keyword search tool below to find specific information within the annual report.-
 1
1 -
2
-
3
-
4
-
5
-
6
-
7
-
8
-
9
-
10
-
11
-
12
-
13
-
14
-
15
-
16
-
17
-
18
-
19
-
20
-
21
-
22
-
23
-
24
-
25
-
26
-
27
-
28
-
29
-
30
-
31
-
32
-
33
-
34
-
35
-
36
-
37
-
38
-
39
-
40
-
41
-
42
-
43
-
44
-
45
-
46
-
47
-
48
-
49
-
50
-
51
-
52
-
53
-
54
-
55
-
56
-
57
-
58
-
59
-
60
-
61
-
62
-
63
-
64
-
65
-
66
-
67
-
68
-
69
-
70
-
71
-
72
-
73
-
74
-
75
-
76
-
77
-
78
-
79
-
80
-
81
-
82
-
83
-
84
-
85
-
86
-
87
-
88
-
89
-
90
-
91
-
92
-
93
-
94
-
95
-
96
-
97
-
98
-
99
-
100
-
101
-
102
-
103
-
104
-
105
-
106
-
107
-
108
-
109
-
110
-
111
-
112
-
113
-
114
-
115
-
116
-
117
-
118
-
119
-
120
-
121
-
122
-
123
-
124
-
125
-
126
-
127
-
128
-
129
-
130
-
131
-
132
-
133
-
134
-
135
-
136
-
137
-
138
-
139
-
140
-
141
-
142
-
143
-
144
-
145
-
146
-
147
-
148
-
149
-
150
-
151
-
152
-
153
-
154
-
155
-
156
-
157
-
158
-
159
-
160
-
161
-
162
-
163
-
164
-
165
-
166
-
167
-
168
-
169
-
170
-
171
-
172
-
 173
173 -
 174
174 -
 175
175 -
 176
176 -
 177
177 -
 178
178 -
 179
179 -
 180
180 -
 181
181 -
 182
182 -
 183
183 -
 184
184 -
 185
185 -
 186
186 -
 187
187 -
 188
188 -
 189
189 -
 190
190 -
 191
191 -
 192
192 -
 193
193 -
194
-
195
-
196
-
197
-
198
-
199
-
200
-
201
-
202
-
203
-
204
-
205
-
206
-
207
-
208
-
209
-
210
-
211
-
212
-
213
-
214
-
215
-
216
-
217
-
218
-
219
-
220
-
221
-
222
-
223
-
224
-
225
-
226
-
227
-
228
-
229
-
230
-
231
-
232
-
233
-
234
-
235
-
236
-
237
-
238
-
239
-
240
-
241
-
242
-
243
-
244
-
245
-
246
 |
 |

181REGISTRATION DOCUMENT − L’ORÉAL 2011
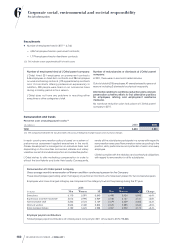
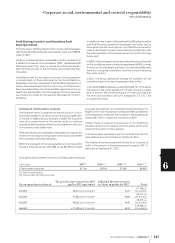
Corporate social, environmental and societal responsibility
6
Social information
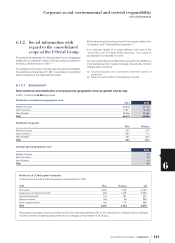
6.1.2. Social information with
regard to the consolidated
scope of the L’Oréal Group
The workforce indicated in the “
Total workforce
” and “
Geographic
distribution of workforce
” charts is the total workforce present in
the Group at December31st, 2011(1).
For Galderma and Innéov that are proportionally consolidated,
the workforce at December31st,2011 is recorded on a prorated
basis according to the stake held byL’Oréal.
All the other social indicators set out in this chapter relate to the
“Cosmetics” and “The Body Shop branches”(2).
If an indicator relates to a scope different from that of the
“Cosmetics and The Body Shop branches”, the scope of
consolidation is indicated in a note.
For each social theme handled and pursuant to the NRE law, a
more detailed section may be included and will only concern
L’Oréal parent company.
(1) Including employees with a permanent or fixed-term contract of
employment.
(2) Innéov is included, Galderma (dermatology) is excluded.
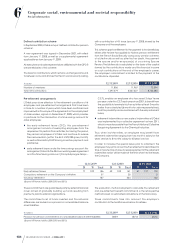
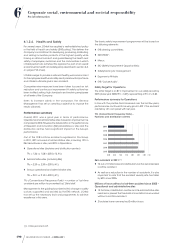
6.1.2.1. Employment
Total workforce and distribution of employees by geographic zone, by gender and by age
In2011, L’Oréal had 68,886employees.
Distribution of workforce by geographic zone
2010 2011
Western Europe 29,542 30,155
North America 14,811 15,195
New Markets 22,266 23,536
Total 66,619 68,886
Distribution by gender
Men Women
Western Europe 33% 67%
North America 29% 71%
New Markets 36% 64%
Total 33% 67%
Average age by geographic zone
2011
Western Europe 38
North America 38
New Markets 34
Total 37
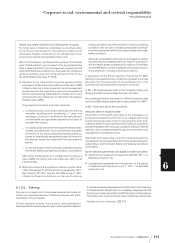
Workforce at L’Oréal parent company
L’OréalS.A. had a total of 6,015employees at December31st, 2011.
2011 Men Women All
Executives 1,392 1,753 3,145
Supervisors and technical staff 452 1,576 2,028
Administrative staff 116 191 307
Manual workers 155 95 250
Sales representatives 166 119 285
Total 2,281 3,734 6,015
Temporary employees should be added to this total; they represented 2.43% of the workforce on average and an average
monthly number of 166 temporary workers for an average contract length of 15.15days.