ICICI Bank 2015 Annual Report Download - page 98
Download and view the complete annual report
Please find page 98 of the 2015 ICICI Bank annual report below. You can navigate through the pages in the report by either clicking on the pages listed below, or by using the keyword search tool below to find specific information within the annual report.-
 1
1 -
2
-
3
-
4
-
5
-
6
-
7
-
8
-
9
-
10
-
11
-
12
-
13
-
14
-
15
-
16
-
17
-
18
-
19
-
20
-
21
-
22
-
23
-
24
-
25
-
26
-
27
-
28
-
29
-
30
-
31
-
32
-
33
-
34
-
35
-
36
-
37
-
38
-
39
-
40
-
41
-
42
-
43
-
44
-
45
-
46
-
47
-
48
-
49
-
50
-
51
-
52
-
53
-
54
-
55
-
56
-
57
-
58
-
59
-
60
-
61
-
62
-
63
-
64
-
65
-
66
-
67
-
68
-
69
-
70
-
71
-
72
-
73
-
74
-
75
-
76
-
77
-
78
-
79
-
80
-
81
-
82
-
83
-
84
-
85
-
86
-
87
-
 88
88 -
 89
89 -
 90
90 -
 91
91 -
 92
92 -
 93
93 -
 94
94 -
 95
95 -
 96
96 -
 97
97 -
 98
98 -
 99
99 -
 100
100 -
 101
101 -
 102
102 -
 103
103 -
 104
104 -
 105
105 -
 106
106 -
 107
107 -
 108
108 -
109
-
110
-
111
-
112
-
113
-
114
-
115
-
116
-
117
-
118
-
119
-
120
-
121
-
122
-
123
-
124
-
125
-
126
-
127
-
128
-
129
-
130
-
131
-
132
-
133
-
134
-
135
-
136
-
137
-
138
-
139
-
140
-
141
-
142
-
143
-
144
-
145
-
146
-
147
-
148
-
149
-
150
-
151
-
152
-
153
-
154
-
155
-
156
-
157
-
158
-
159
-
160
-
161
-
162
-
163
-
164
-
165
-
166
-
167
-
168
-
169
-
170
-
171
-
172
-
173
-
174
-
175
-
176
-
177
-
178
-
179
-
180
-
181
-
182
-
183
-
184
-
185
-
186
-
187
-
188
-
189
-
190
-
191
-
192
-
193
-
194
-
195
-
196
-
197
-
198
-
199
-
200
-
201
-
202
-
203
-
204
-
205
-
206
-
207
-
208
-
209
-
210
-
211
-
212
-
213
-
214
-
215
-
216
-
217
-
218
-
219
-
220
-
221
-
222
-
223
-
224
-
225
-
226
-
227
-
228
-
229
-
230
-
231
-
232
-
233
-
234
-
235
-
236
 |
 |

Management’s Discussion & Analysis
96 Annual Report 2014-2015
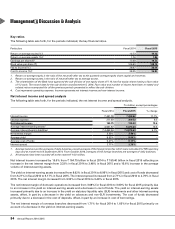
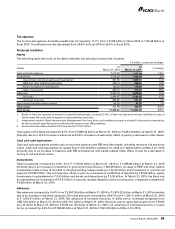
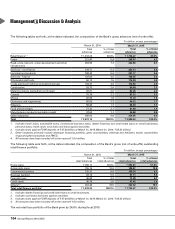
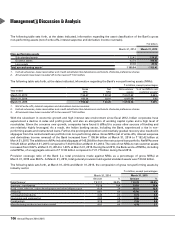
The following table sets forth, for the period indicated, the trend in average interest-earning assets and average interest-
bearing liabilities:
` in billion, except percentages
Fiscal 2014 Fiscal 2015 % change
Advances ` 3,144.21 ` 3,579.93 13.9%
Interest-earning investments 1,544.96 1,598.33 3.5
Other interest-earning assets 262.40 298.38 13.7
Total interest-earning assets 4,951.57 5,476.64 10.6
Deposits 2,922.42 3,285.52 12.4
Borrowings11,540.12 1,585.11 2.9
Total interest-bearing liabilities ` 4,462.54 ` 4,870.63 9.1%
1. Borrowings exclude preference share capital.
2. Average investments and average borrowings include average short-term repurchase transactions.
3. Average balances are the averages of daily balances, except averages of the foreign branches which were calculated at RBI reporting
days and at month-end till September 2014. From October 2014, averages of the foreign branches are averages of daily balances.
4. All amounts have been rounded off to the nearest ` 10.0 million.
The average volume of interest-earning assets increased by 10.6% from ` 4,951.57 billion in fiscal 2014 to ` 5,476.64 billion
in fiscal 2015. The increase in average interest-earning assets was primarily on account of an increase in average advances
by ` 435.72 billion and average interest-earning investments by ` 53.37 billion.
Average advances increased by 13.9% from ` 3,144.21 billion in fiscal 2014 to ` 3,579.93 billion in fiscal 2015, on account
of an increase in domestic advances.
Average interest-earning investments increased by 3.5% from ` 1,544.96 billion in fiscal 2014 to ` 1,598.33 billion in fiscal
2015, primarily due to an increase in average SLR investments by 2.9% from ` 964.73 billion in fiscal 2014 to ` 992.42
billion in fiscal 2015. Average non-SLR investments increased by 4.4% from ` 580.23 billion in fiscal 2014 to ` 605.91 billion
in fiscal 2015 primarily due to an increase in PTCs and RIDF & other related investments, offset, in part, by a decrease in
certificates of deposits and bonds & debentures. Interest-earning non-SLR investments primarily include investments in
corporate bonds & debentures, certificates of deposits, commercial paper, RIDF & related investments and investments in
liquid mutual funds.
Average interest-bearing liabilities increased by 9.1% from ` 4,462.54 billion in fiscal 2014 to ` 4,870.63 billion in fiscal 2015
on account of an increase of ` 363.10 billion in average deposits and an increase of ` 44.99 billion in average borrowings.
The ratio of average CASA deposits to average deposits was at 39.5% in fiscal 2015 compared to 39.4% in fiscal 2014.
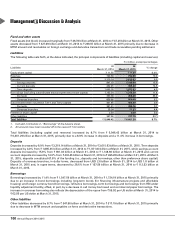
Non-interest income
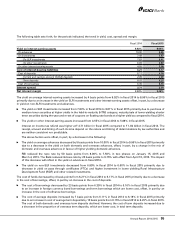
The following tables set forth, for the periods indicated, the principal components of non-interest income.
` in billion, except percentages
Particulars Fiscal 2014 Fiscal 2015 % change
Fee income1` 77.58 ` 82.87 6.8%
Income from treasury-related activities 10.17 16.93 66.5
Dividend from subsidiaries 12.96 15.59 20.3
Other income (including lease income)23.57 6.37 78.4
Total non-interest income ` 104.28 ` 121.76 16.8%
1. Includes merchant foreign exchange income and income on customer derivative transactions.
2. Includes exchange gains related to overseas operations.
3. All amounts have been rounded off to the nearest ` 10.0 million.
Non-interest income primarily includes fee and commission income, income from treasury-related activities, dividend from
subsidiaries and other income including lease income. The non-interest income increased by 16.8% from ` 104.28 billion
in fiscal 2014 to ` 121.76 billion in fiscal 2015.