ICICI Bank 2015 Annual Report Download - page 158
Download and view the complete annual report
Please find page 158 of the 2015 ICICI Bank annual report below. You can navigate through the pages in the report by either clicking on the pages listed below, or by using the keyword search tool below to find specific information within the annual report.-
 1
1 -
2
-
3
-
4
-
5
-
6
-
7
-
8
-
9
-
10
-
11
-
12
-
13
-
14
-
15
-
16
-
17
-
18
-
19
-
20
-
21
-
22
-
23
-
24
-
25
-
26
-
27
-
28
-
29
-
30
-
31
-
32
-
33
-
34
-
35
-
36
-
37
-
38
-
39
-
40
-
41
-
42
-
43
-
44
-
45
-
46
-
47
-
48
-
49
-
50
-
51
-
52
-
53
-
54
-
55
-
56
-
57
-
58
-
59
-
60
-
61
-
62
-
63
-
64
-
65
-
66
-
67
-
68
-
69
-
70
-
71
-
72
-
73
-
74
-
75
-
76
-
77
-
78
-
79
-
80
-
81
-
82
-
83
-
84
-
85
-
86
-
87
-
88
-
89
-
90
-
91
-
92
-
93
-
94
-
95
-
96
-
97
-
98
-
99
-
100
-
101
-
102
-
103
-
104
-
105
-
106
-
107
-
108
-
109
-
110
-
111
-
112
-
113
-
114
-
115
-
116
-
117
-
118
-
119
-
120
-
121
-
122
-
123
-
124
-
125
-
126
-
127
-
128
-
129
-
130
-
131
-
132
-
133
-
134
-
135
-
136
-
137
-
138
-
139
-
140
-
141
-
142
-
143
-
144
-
145
-
146
-
147
-
 148
148 -
 149
149 -
 150
150 -
 151
151 -
 152
152 -
 153
153 -
 154
154 -
 155
155 -
 156
156 -
 157
157 -
 158
158 -
 159
159 -
 160
160 -
 161
161 -
 162
162 -
 163
163 -
 164
164 -
 165
165 -
 166
166 -
 167
167 -
 168
168 -
169
-
170
-
171
-
172
-
173
-
174
-
175
-
176
-
177
-
178
-
179
-
180
-
181
-
182
-
183
-
184
-
185
-
186
-
187
-
188
-
189
-
190
-
191
-
192
-
193
-
194
-
195
-
196
-
197
-
198
-
199
-
200
-
201
-
202
-
203
-
204
-
205
-
206
-
207
-
208
-
209
-
210
-
211
-
212
-
213
-
214
-
215
-
216
-
217
-
218
-
219
-
220
-
221
-
222
-
223
-
224
-
225
-
226
-
227
-
228
-
229
-
230
-
231
-
232
-
233
-
234
-
235
-
236
 |
 |

156 Annual Report 2014-2015
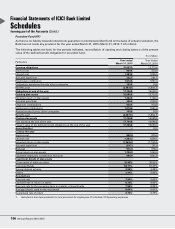
Schedules
forming part of the Accounts (Contd.)
Financial Statements of ICICI Bank Limited
` in million, except number of accounts
Type of Restructuring Others Total
Sr.
no. Asset Classification Details
Standard
(a)
Sub-
Standard
(b)
Doubtful
(c)
Loss
(d)
Total
(e)
Standard
(a)
Sub-
Standard
(b)
Doubtful
(c)
Loss
(d)
Total
(e)
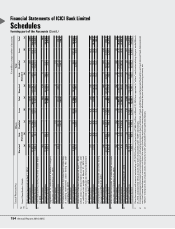
1. Restructured accounts at April 1, 20131
No. of borrowers 140 8 283 4 435 174 8 295 7 484
Amount outstanding 17,676.7 1,855.9 5,650.6 138.1 25,321.3 58,252.2 1,855.9 9,004.8 316.2 69,429.1
Provision thereon 782.9 159.6 3,738.0 138.1 4,818.6 5,103.8 159.6 5,955.6 316.2 11,535.2
2. Fresh restructuring during the year ended March
31, 2014
No. of borrowers 726 – 1 – 727 745 – 1 – 746
Amount outstanding 22,458.6 – 1,534.0 – 23,992.6 62,310.6 – 1,534.0 – 63,844.6
Provision thereon 1,638.2 – 562.7 – 2,200.9 5,854.4 – 562.7 – 6,417.1
3. Upgradations to restructured standard category
during the year ended March 31, 20142
No. of borrowers 53 (2) (51) – –54 (2) (52) – –
Amount outstanding 78.7 (2.4) (80.6) – (4.3) 153.5 (2.4) (134.2) – 16.9
Provision thereon 2.9 (0.4) (70.3) – (67.8) 4.8 (0.4) (95.4) – (91.0)
4. Increase/(decrease) in borrower level outstanding
of existing restructured cases during the year
ended March 31, 20143
No. of borrowers – – – – –– – – – –
Amount outstanding 1,304.2 – (26.6) 9.4 1,287.0 4,016.0 – (91.5) 9.4 3,933.9
Provision thereon 150.5 – 501.1 9.4 661.0 766.4 – 852.8 9.4 1,628.6
5. Restructured standard advances at April 1, 2013,
which cease to attract higher provisioning and/
or additional risk weight at March 31, 2014 and
hence need not be shown as restructured standard
advances at April 1, 2014
No. of borrowers (72) N.A. N.A. N.A. (72) (73) N.A. N.A. N.A. (73)
Amount outstanding (661.2) N.A. N.A. N.A. (661.2) (661.9) N.A. N.A. N.A. (661.9)
Provision thereon (3.8) N.A. N.A. N.A. (3.8) (4.2) N.A. N.A. N.A. (4.2)
6. Downgradations of restructured accounts during
the year ended March 31, 20142
No. of borrowers (18) 2 7 9 –(24) 2 13 9 –
Amount outstanding (5,055.9) (1,565.9) 6,386.4 456.1 220.7 (7,274.7) (1,565.9) 8,544.0 456.1 159.5
Provision thereon (438.4) (80.9) 3,306.8 203.8 2,991.3 (780.0) (80.9) 4,714.4 203.8 4,057.3
7. Write-offs/recovery/sale of restructured accounts
during the year ended March 31, 2014
No. of borrowers (19) – (52) – (71) (20) – (55) (2) (77)
Amount outstanding (226.0) – (1,729.2) – (1,955.2) (271.0) – (1,864.3) (157.0) (2,292.3)
Provision thereon – – (1,002.8) – (1,002.8) – – (1,118.0) (157.0) (1,275.0)
8. Restructured accounts at March 31, 2014
No. of borrowers 810 8 188 13 1,019 856 8 202 14 1,080
Amount outstanding 35,575.1 287.6 11,734.6 603.6 48,200.9 116,524.7 287.6 16,992.8 624.7 134,429.8
Provision thereon 2,132.3 78.3 7,035.5 351.3 9,597.4 10,945.2 78.3 10,872.1 372.4 22,268.0
1. One borrower with amount outstanding of ` 5,214.3 million and provision of ` 686.1 million at March 31, 2013 was reported in “others” mechanism in FY2013. Subsequently the
account has been reclassified under “CDR” mechanism at April 1, 2013.
2. In cases upgraded to restructured standard category and in cases downgraded to lower asset classification, the amount shown as deleted represents the outstanding at March
31, 2013 and that shown in addition represents outstanding at March 31, 2014.
3. Increase/(decrease) in borrower level outstanding of existing restructured accounts is due to utilisation of cash credit facility, exchange rate fluctuation, accrued interest, fresh
disbursement, non-fund based devolvement etc.