ICICI Bank 2015 Annual Report Download - page 149
Download and view the complete annual report
Please find page 149 of the 2015 ICICI Bank annual report below. You can navigate through the pages in the report by either clicking on the pages listed below, or by using the keyword search tool below to find specific information within the annual report.-
 1
1 -
2
-
3
-
4
-
5
-
6
-
7
-
8
-
9
-
10
-
11
-
12
-
13
-
14
-
15
-
16
-
17
-
18
-
19
-
20
-
21
-
22
-
23
-
24
-
25
-
26
-
27
-
28
-
29
-
30
-
31
-
32
-
33
-
34
-
35
-
36
-
37
-
38
-
39
-
40
-
41
-
42
-
43
-
44
-
45
-
46
-
47
-
48
-
49
-
50
-
51
-
52
-
53
-
54
-
55
-
56
-
57
-
58
-
59
-
60
-
61
-
62
-
63
-
64
-
65
-
66
-
67
-
68
-
69
-
70
-
71
-
72
-
73
-
74
-
75
-
76
-
77
-
78
-
79
-
80
-
81
-
82
-
83
-
84
-
85
-
86
-
87
-
88
-
89
-
90
-
91
-
92
-
93
-
94
-
95
-
96
-
97
-
98
-
99
-
100
-
101
-
102
-
103
-
104
-
105
-
106
-
107
-
108
-
109
-
110
-
111
-
112
-
113
-
114
-
115
-
116
-
117
-
118
-
119
-
120
-
121
-
122
-
123
-
124
-
125
-
126
-
127
-
128
-
129
-
130
-
131
-
132
-
133
-
134
-
135
-
136
-
137
-
138
-
 139
139 -
 140
140 -
 141
141 -
 142
142 -
 143
143 -
 144
144 -
 145
145 -
 146
146 -
 147
147 -
 148
148 -
 149
149 -
 150
150 -
 151
151 -
 152
152 -
 153
153 -
 154
154 -
 155
155 -
 156
156 -
 157
157 -
 158
158 -
 159
159 -
160
-
161
-
162
-
163
-
164
-
165
-
166
-
167
-
168
-
169
-
170
-
171
-
172
-
173
-
174
-
175
-
176
-
177
-
178
-
179
-
180
-
181
-
182
-
183
-
184
-
185
-
186
-
187
-
188
-
189
-
190
-
191
-
192
-
193
-
194
-
195
-
196
-
197
-
198
-
199
-
200
-
201
-
202
-
203
-
204
-
205
-
206
-
207
-
208
-
209
-
210
-
211
-
212
-
213
-
214
-
215
-
216
-
217
-
218
-
219
-
220
-
221
-
222
-
223
-
224
-
225
-
226
-
227
-
228
-
229
-
230
-
231
-
232
-
233
-
234
-
235
-
236
 |
 |

147Annual Report 2014-2015
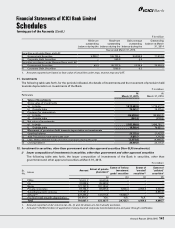
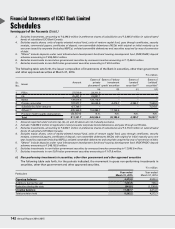
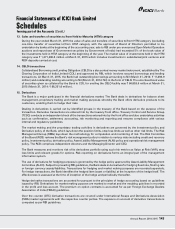
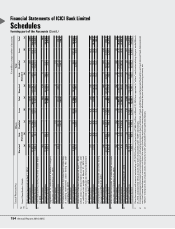
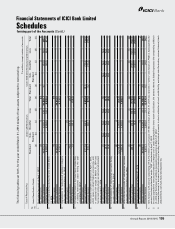
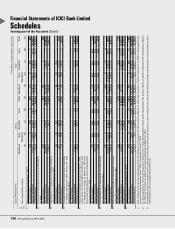
forming part of the Accounts (Contd.)
Schedules
Financial Statements of ICICI Bank Limited
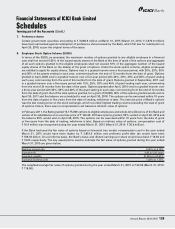
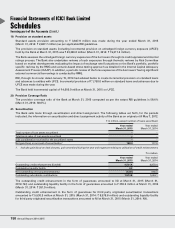
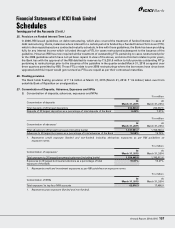
An IRS is a financial contract between two parties exchanging or swapping a stream of interest payments for a ‘notional
principal’ amount on multiple occasions during a specified period. The Bank deals in interest rate benchmarks like
Mumbai Inter-Bank Offered Rate (MIBOR), Indian government securities Benchmark rate (INBMK), Mumbai Inter Bank
Forward Offer Rate (MIFOR) and LIBOR of various currencies.
These contracts are subject to the risks of changes in market interest rates as well as the settlement risk with the
counterparties.
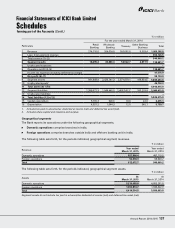
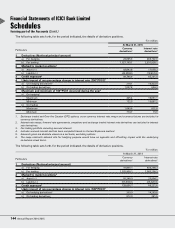
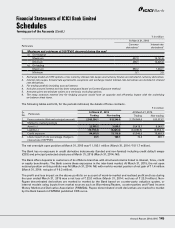
The following table sets forth, for the periods indicated, the details of the forward rate agreements/interest rate swaps.
` in million
Particulars At
March 31, 2015
At
March 31, 2014
i) The notional principal of FRA/IRS 2,936,228.7 2,401,993.1
ii) Losses which would be incurred if all counter parties failed to fulfil their
obligations under the agreement1
22,018.1 29,809.2
iii) Collateral required by the Bank upon entering into FRA/IRS – –
iv) Concentration of credit risk2 1,610.7 1,766.6
v) The fair value of FRA/IRS3 15,174.9 13,005.0
1. For trading portfolio both mark-to-market and accrued interest have been considered and for hedging portfolio, only accrued
interest has been considered.
2. Credit risk concentration is measured as the highest net receivable under swap contracts from a particular counter party.
3. Fair value represents mark-to-market including accrued interest.
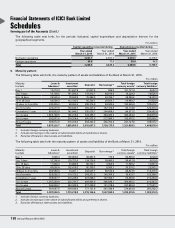
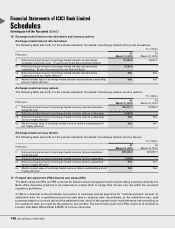
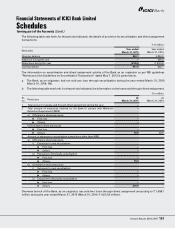
The following tables set forth, the nature and terms of FRA/IRS at March 31, 2015
Hedging ` in million
Benchmark Type Notional principal No. of deals
USD LIBOR Fixed receivable v/s floating payable 434,676.8 90
JPY LIBOR Fixed receivable v/s floating payable 2,602.4 1
SGD SOR Fixed receivable v/s floating payable 12,960.7 7
AUD LIBOR Fixed receivable v/s floating payable 7,130.3 3
CHF LIBOR Fixed receivable v/s floating payable 6,422.8 2
Total 463,792.9 103
Trading ` in million
Benchmark Type Notional principal No. of deals
INBMK Floating receivable v/s fixed payable 46,379.6 74
INBMK Fixed receivable v/s floating payable 18,000.0 36
MIBOR Floating receivable v/s fixed payable 398,742.0 605
MIBOR Fixed receivable v/s floating payable 406,038.1 625
MIBOR Floating receivable v/s floating payable 2,000.0 1
MIFOR Floating receivable v/s fixed payable 243,425.0 526
MIFOR Fixed receivable v/s floating payable 261,565.0 553
Other Fixed receivable v/s fixed payable 20,128.0 118
USD LIBOR Floating receivable v/s fixed payable 481,636.8 447
USD LIBOR Fixed receivable v/s floating payable 488,955.8 684
USD LIBOR Floating receivable v/s floating payable 26,810.1 43
JPY LIBOR Floating receivable v/s fixed payable 4,439.3 8
JPY LIBOR Fixed receivable v/s floating payable 8,470.7 16
JPY LIBOR Floating receivable v/s floating payable 2,264.8 4
EURIBOR Floating receivable v/s fixed payable 6,277.3 12
EURIBOR Fixed receivable v/s floating payable 7,249.0 19
EURIBOR Floating receivable v/s floating payable 670.7 1