ICICI Bank 2015 Annual Report Download - page 96
Download and view the complete annual report
Please find page 96 of the 2015 ICICI Bank annual report below. You can navigate through the pages in the report by either clicking on the pages listed below, or by using the keyword search tool below to find specific information within the annual report.-
 1
1 -
2
-
3
-
4
-
5
-
6
-
7
-
8
-
9
-
10
-
11
-
12
-
13
-
14
-
15
-
16
-
17
-
18
-
19
-
20
-
21
-
22
-
23
-
24
-
25
-
26
-
27
-
28
-
29
-
30
-
31
-
32
-
33
-
34
-
35
-
36
-
37
-
38
-
39
-
40
-
41
-
42
-
43
-
44
-
45
-
46
-
47
-
48
-
49
-
50
-
51
-
52
-
53
-
54
-
55
-
56
-
57
-
58
-
59
-
60
-
61
-
62
-
63
-
64
-
65
-
66
-
67
-
68
-
69
-
70
-
71
-
72
-
73
-
74
-
75
-
76
-
77
-
78
-
79
-
80
-
81
-
82
-
83
-
84
-
85
-
 86
86 -
 87
87 -
 88
88 -
 89
89 -
 90
90 -
 91
91 -
 92
92 -
 93
93 -
 94
94 -
 95
95 -
 96
96 -
 97
97 -
 98
98 -
 99
99 -
 100
100 -
 101
101 -
 102
102 -
 103
103 -
 104
104 -
 105
105 -
 106
106 -
107
-
108
-
109
-
110
-
111
-
112
-
113
-
114
-
115
-
116
-
117
-
118
-
119
-
120
-
121
-
122
-
123
-
124
-
125
-
126
-
127
-
128
-
129
-
130
-
131
-
132
-
133
-
134
-
135
-
136
-
137
-
138
-
139
-
140
-
141
-
142
-
143
-
144
-
145
-
146
-
147
-
148
-
149
-
150
-
151
-
152
-
153
-
154
-
155
-
156
-
157
-
158
-
159
-
160
-
161
-
162
-
163
-
164
-
165
-
166
-
167
-
168
-
169
-
170
-
171
-
172
-
173
-
174
-
175
-
176
-
177
-
178
-
179
-
180
-
181
-
182
-
183
-
184
-
185
-
186
-
187
-
188
-
189
-
190
-
191
-
192
-
193
-
194
-
195
-
196
-
197
-
198
-
199
-
200
-
201
-
202
-
203
-
204
-
205
-
206
-
207
-
208
-
209
-
210
-
211
-
212
-
213
-
214
-
215
-
216
-
217
-
218
-
219
-
220
-
221
-
222
-
223
-
224
-
225
-
226
-
227
-
228
-
229
-
230
-
231
-
232
-
233
-
234
-
235
-
236
 |
 |

Management’s Discussion & Analysis
94 Annual Report 2014-2015
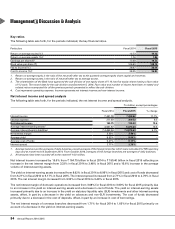
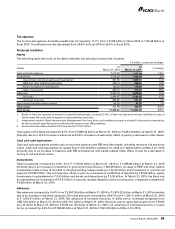
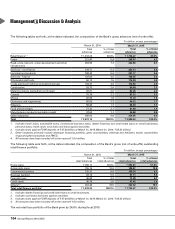
Key ratios
The following table sets forth, for the periods indicated, the key financial ratios.
Particulars Fiscal 2014 Fiscal 2015
Return on average equity (%)1 13.73 14.32
Return on average assets (%)2 1.76 1.86
Earnings per share (`)3 17.00 19.32
Book value per share (`) 126.80 138.74
Fee to income (%) 28.87 26.55
Cost to income (%)4 38.25 36.83
1. Return on average equity is the ratio of the net profit after tax to the quarterly average equity share capital and reserves.
2. Return on average assets is the ratio of net profit after tax to average assets.
3. The shareholders of the Bank have approved the sub-division of one equity share of ` 10 into five equity shares having a face value
of ` 2 each. The record date for the sub-division was December 5, 2014. Face value and number of shares have been re-stated and
related ratios recomputed for all the previous periods presented to reflect the sub-division.
4. Cost represents operating expense. Income represents net interest income and non-interest income.
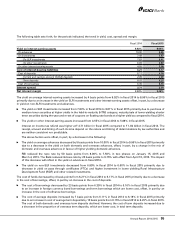
Net interest income and spread analysis
The following table sets forth, for the periods indicated, the net interest income and spread analysis.
` in billion, except percentages
Fiscal 2014 Fiscal 2015 % change
Interest income ` 441.78 ` 490.92 11.1%
Interest expense 277.03 300.52 8.5
Net interest income 164.75 190.40 15.6
Average interest-earning assets1 4,951.57 5,476.64 10.6
Average interest-bearing liabilities1` 4,462.54 ` 4,870.63 9.1%
Net interest margin 3.33% 3.48% –
Average yield 8.92% 8.96% –
Average cost of funds 6.21% 6.17% –
Interest spread 2.71% 2.79% –
1. Average balances are the averages of daily balances, except averages of the foreign branches which were calculated for RBI reporting
days and at month-end till September 2014. From October 2014, averages of the foreign branches are averages of daily balances.
2. All amounts have been rounded off to the nearest ` 10.0 million.
Net interest income increased by 15.6% from ` 164.75 billion in fiscal 2014 to ` 190.40 billion in fiscal 2015 reflecting an
increase in the net interest margin from 3.33% in fiscal 2014 to 3.48% in fiscal 2015 and a 10.6% increase in the average
volume of interest-earning assets.
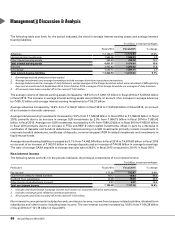
The yield on interest-earning assets increased from 8.92% in fiscal 2014 to 8.96% in fiscal 2015 and cost of funds decreased
from 6.21% in fiscal 2014 to 6.17% in fiscal 2015. The interest spread increased from 2.71% in fiscal 2014 to 2.79% in fiscal
2015. The net interest margin increased from 3.33% in fiscal 2014 to 3.48% in fiscal 2015.
The net interest margin of domestic operations increased from 3.68% for fiscal 2014 to 3.90% for fiscal 2015 primarily due
to an increase in the yield on interest-earning assets and a decrease in cost of funds. The yield on interest-earning assets
increased primarily due to an increase in the yield on statutory liquidity ratio (SLR) investments and other interest-earning
assets, offset, in part by a decrease in the yield on advances and non-SLR investments. The cost of funds decreased
primarily due to a decrease in the cost of deposits, offset, in part by an increase in cost of borrowings.
The net interest margin of overseas branches decreased from 1.71% for fiscal 2014 to 1.65% for fiscal 2015 primarily on
account of a decrease in the yield on interest-earning assets.