ICICI Bank 2015 Annual Report Download - page 217
Download and view the complete annual report
Please find page 217 of the 2015 ICICI Bank annual report below. You can navigate through the pages in the report by either clicking on the pages listed below, or by using the keyword search tool below to find specific information within the annual report.-
 1
1 -
2
-
3
-
4
-
5
-
6
-
7
-
8
-
9
-
10
-
11
-
12
-
13
-
14
-
15
-
16
-
17
-
18
-
19
-
20
-
21
-
22
-
23
-
24
-
25
-
26
-
27
-
28
-
29
-
30
-
31
-
32
-
33
-
34
-
35
-
36
-
37
-
38
-
39
-
40
-
41
-
42
-
43
-
44
-
45
-
46
-
47
-
48
-
49
-
50
-
51
-
52
-
53
-
54
-
55
-
56
-
57
-
58
-
59
-
60
-
61
-
62
-
63
-
64
-
65
-
66
-
67
-
68
-
69
-
70
-
71
-
72
-
73
-
74
-
75
-
76
-
77
-
78
-
79
-
80
-
81
-
82
-
83
-
84
-
85
-
86
-
87
-
88
-
89
-
90
-
91
-
92
-
93
-
94
-
95
-
96
-
97
-
98
-
99
-
100
-
101
-
102
-
103
-
104
-
105
-
106
-
107
-
108
-
109
-
110
-
111
-
112
-
113
-
114
-
115
-
116
-
117
-
118
-
119
-
120
-
121
-
122
-
123
-
124
-
125
-
126
-
127
-
128
-
129
-
130
-
131
-
132
-
133
-
134
-
135
-
136
-
137
-
138
-
139
-
140
-
141
-
142
-
143
-
144
-
145
-
146
-
147
-
148
-
149
-
150
-
151
-
152
-
153
-
154
-
155
-
156
-
157
-
158
-
159
-
160
-
161
-
162
-
163
-
164
-
165
-
166
-
167
-
168
-
169
-
170
-
171
-
172
-
173
-
174
-
175
-
176
-
177
-
178
-
179
-
180
-
181
-
182
-
183
-
184
-
185
-
186
-
187
-
188
-
189
-
190
-
191
-
192
-
193
-
194
-
195
-
196
-
197
-
198
-
199
-
200
-
201
-
202
-
203
-
204
-
205
-
206
-
 207
207 -
 208
208 -
 209
209 -
 210
210 -
 211
211 -
 212
212 -
 213
213 -
 214
214 -
 215
215 -
 216
216 -
 217
217 -
 218
218 -
 219
219 -
 220
220 -
 221
221 -
 222
222 -
 223
223 -
 224
224 -
 225
225 -
 226
226 -
 227
227 -
228
-
229
-
230
-
231
-
232
-
233
-
234
-
235
-
236
 |
 |

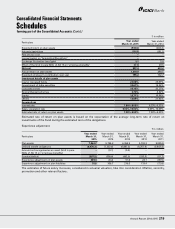
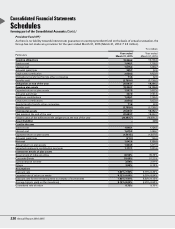
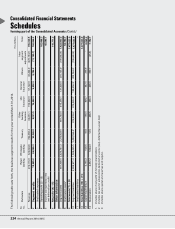
forming part of the Consolidated Accounts (Contd.)
Schedules
215Annual Report 2014-2015
Consolidated Financial Statements
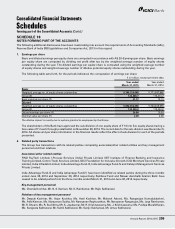
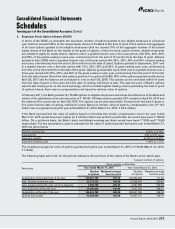
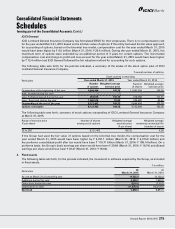
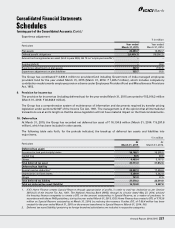
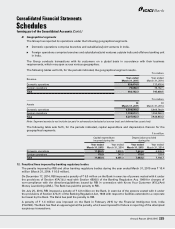
ICICI General:
ICICI Lombard General Insurance Company has formulated ESOS for their employees. There is no compensation cost
for the year ended March 31, 2015 based on the intrinsic value of options. If the entity had used the fair value approach
for accounting of options, based on the binomial tree model, compensation cost for the year ended March 31, 2015
would have been higher by ` 4.5 million (March 31, 2014: ` 20.6 million). During the year ended March 31, 2015, the
maximum term of options were extended by an additional period of 3 years for certain options. The incremental
compensation cost and charge to profit and loss account for the year ended March 31, 2015 would have been higher
by ` 12.4 million had ICICI General followed the fair valuation method for accounting for such options.
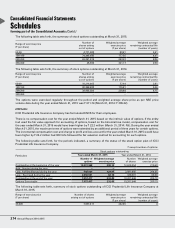
The following table sets forth, for the periods indicated, a summary of the status of the stock option plan of ICICI
Lombard General Insurance Company.
` except number of options
Particulars
Stock options outstanding
Year ended March 31, 2015 Year ended March 31, 2014
Number
of options
Weighted average
exercise price
Number
of shares
Weighted average
exercise price
Outstanding at the beginning of the year 9,844,494 105.39 11,097,924 100.35
Add: Granted during the year – – – –
Less: Forfeited/ lapsed during the year 254,516 116.10 318,750 111.71
Less : Exercised during the year 1,468,516 81.82 934,680 43.40
Outstanding at the end of the year 8,121,462 109.32 9,844,494 105.39
Options exercisable 8,121,462 109.32 9,153,684 105.26
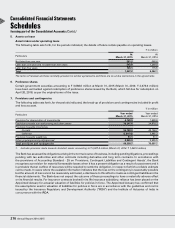
The following table sets forth, summary of stock options outstanding of ICICI Lombard General Insurance Company
at March 31, 2015.
Range of exercise price
(` per share)
Number of shares
arising out of options
Weighted average
exercise price
(` per share)
Weighted average
remaining contractual life
(number of years)
35 to 200 8,121,462 109.32 4.28
If the Group had used the fair value of options based on the binomial tree model, the compensation cost for the
year ended March 31, 2015 would have been higher by ` 2,761.1 million (March 31, 2014: ` 2,273.0 million) and
the proforma consolidated profit after tax would have been ` 119.71 billion (March 31, 2014: ` 108.14 billion). On a
proforma basis, the Group’s basic earnings per share would have been ` 20.69 (March 31, 2014: ` 18.74) and diluted
earnings per share would have been ` 20.47 (March 31, 2014: ` 18.64).
4. Fixed assets
The following table sets forth, for the periods indicated, the movement in software acquired by the Group, as included
in fixed assets.
` in million
Particulars At
March 31, 2015
At
March 31, 2014
At cost at March 31 of preceding year 13,525.0 12,102.3
Additions during the year 2,439.1 1,533.2
Deductions during the year (229.0) (110.5)
Depreciation to date (11,876.8) (10,213.9)
Net block 3,858.3 3,311.1