ICICI Bank 2015 Annual Report Download - page 39
Download and view the complete annual report
Please find page 39 of the 2015 ICICI Bank annual report below. You can navigate through the pages in the report by either clicking on the pages listed below, or by using the keyword search tool below to find specific information within the annual report.-
 1
1 -
2
-
3
-
4
-
5
-
6
-
7
-
8
-
9
-
10
-
11
-
12
-
13
-
14
-
15
-
16
-
17
-
18
-
19
-
20
-
21
-
22
-
23
-
24
-
25
-
26
-
27
-
28
-
 29
29 -
 30
30 -
 31
31 -
 32
32 -
 33
33 -
 34
34 -
 35
35 -
 36
36 -
 37
37 -
 38
38 -
 39
39 -
 40
40 -
 41
41 -
 42
42 -
 43
43 -
 44
44 -
 45
45 -
 46
46 -
 47
47 -
 48
48 -
 49
49 -
50
-
51
-
52
-
53
-
54
-
55
-
56
-
57
-
58
-
59
-
60
-
61
-
62
-
63
-
64
-
65
-
66
-
67
-
68
-
69
-
70
-
71
-
72
-
73
-
74
-
75
-
76
-
77
-
78
-
79
-
80
-
81
-
82
-
83
-
84
-
85
-
86
-
87
-
88
-
89
-
90
-
91
-
92
-
93
-
94
-
95
-
96
-
97
-
98
-
99
-
100
-
101
-
102
-
103
-
104
-
105
-
106
-
107
-
108
-
109
-
110
-
111
-
112
-
113
-
114
-
115
-
116
-
117
-
118
-
119
-
120
-
121
-
122
-
123
-
124
-
125
-
126
-
127
-
128
-
129
-
130
-
131
-
132
-
133
-
134
-
135
-
136
-
137
-
138
-
139
-
140
-
141
-
142
-
143
-
144
-
145
-
146
-
147
-
148
-
149
-
150
-
151
-
152
-
153
-
154
-
155
-
156
-
157
-
158
-
159
-
160
-
161
-
162
-
163
-
164
-
165
-
166
-
167
-
168
-
169
-
170
-
171
-
172
-
173
-
174
-
175
-
176
-
177
-
178
-
179
-
180
-
181
-
182
-
183
-
184
-
185
-
186
-
187
-
188
-
189
-
190
-
191
-
192
-
193
-
194
-
195
-
196
-
197
-
198
-
199
-
200
-
201
-
202
-
203
-
204
-
205
-
206
-
207
-
208
-
209
-
210
-
211
-
212
-
213
-
214
-
215
-
216
-
217
-
218
-
219
-
220
-
221
-
222
-
223
-
224
-
225
-
226
-
227
-
228
-
229
-
230
-
231
-
232
-
233
-
234
-
235
-
236
 |
 |

37Annual Report 2014-2015
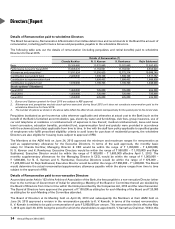
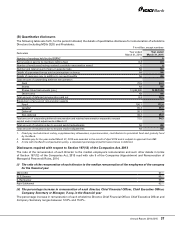
(B) Quantitative disclosures
The following table sets forth, for the period indicated, the details of quantitative disclosure for remuneration of wholetime
Directors (including MD & CEO) and Presidents.
` in million, except numbers
Particulars Year ended
March 31, 2014
Year ended
March 31, 2015
Number of meetings held by the BGRNC 5 5
Remuneration paid to its members (sitting fees) 0.3 0.3
Number of employees having received a variable remuneration award 6 6
Number and total amount of sign-on awards made Nil Nil
Details of guaranteed bonus paid as joining/sign on bonus Nil Nil
Details of severance pay, in addition to accrued benefits Nil Nil
Total amount of outstanding deferred remuneration
Cash 72.5 54.3
Shares Nil Nil
Shares-linked instruments (nos.) 13,982,500 13,057,500
Other forms Nil Nil
Total amount of deferred remuneration paid out 8.3 18.2
Break-down of amount of remuneration awards
Fixed1150.1 172.6
Variable2 65.3 65.0
Deferred3 26.1 –
Non-deferred 39.2 65.0
Total amount of outstanding deferred remuneration and retained remuneration exposed to ex-post
explicit and/or implicit adjustments at March 31
72.5 54.3
Total amount of reductions due to ex-post explicit adjustments Nil Nil
Total amount of reductions due to ex-post implicit adjustments Nil Nil
1. Fixed pay includes basic salary, supplementary allowances, superannuation, contribution to provident fund and gratuity fund
by the Bank.
2. Variable pay for the year ended March 31, 2015 was awarded in the month of April 2015 and is subject to approval from RBI.
3. In line with the Bank’s compensation policy, a stipulated percentage of performance bonus is deferred.
Disclosures required with respect to Section 197(12) of the Companies Act, 2013
The ratio of the remuneration of each Director to the median employee’s remuneration and such other details in terms
of Section 197(12) of the Companies Act, 2013 read with rule 5 of the Companies (Appointment and Remuneration of
Managerial Personnel) Rules, 2014.
(i) The ratio of the remuneration of each director to the median remuneration of the employees of the company
for the nancial year
MD & CEO 97:1
N. S. Kannan 65:1
K. Ramkumar 65:1
Rajiv Sabharwal 62:1
(ii) The percentage increase in remuneration of each director, Chief Financial Ofcer, Chief Executive Ofcer,
Company Secretary or Manager, if any, in the nancial year
The percentage increase in remuneration of each wholetime Director, Chief Financial Officer, Chief Executive Officer and
Company Secretary ranges between 12.0% and 15.0%.