ICICI Bank 2015 Annual Report Download - page 140
Download and view the complete annual report
Please find page 140 of the 2015 ICICI Bank annual report below. You can navigate through the pages in the report by either clicking on the pages listed below, or by using the keyword search tool below to find specific information within the annual report.-
 1
1 -
2
-
3
-
4
-
5
-
6
-
7
-
8
-
9
-
10
-
11
-
12
-
13
-
14
-
15
-
16
-
17
-
18
-
19
-
20
-
21
-
22
-
23
-
24
-
25
-
26
-
27
-
28
-
29
-
30
-
31
-
32
-
33
-
34
-
35
-
36
-
37
-
38
-
39
-
40
-
41
-
42
-
43
-
44
-
45
-
46
-
47
-
48
-
49
-
50
-
51
-
52
-
53
-
54
-
55
-
56
-
57
-
58
-
59
-
60
-
61
-
62
-
63
-
64
-
65
-
66
-
67
-
68
-
69
-
70
-
71
-
72
-
73
-
74
-
75
-
76
-
77
-
78
-
79
-
80
-
81
-
82
-
83
-
84
-
85
-
86
-
87
-
88
-
89
-
90
-
91
-
92
-
93
-
94
-
95
-
96
-
97
-
98
-
99
-
100
-
101
-
102
-
103
-
104
-
105
-
106
-
107
-
108
-
109
-
110
-
111
-
112
-
113
-
114
-
115
-
116
-
117
-
118
-
119
-
120
-
121
-
122
-
123
-
124
-
125
-
126
-
127
-
128
-
129
-
 130
130 -
 131
131 -
 132
132 -
 133
133 -
 134
134 -
 135
135 -
 136
136 -
 137
137 -
 138
138 -
 139
139 -
 140
140 -
 141
141 -
 142
142 -
 143
143 -
 144
144 -
 145
145 -
 146
146 -
 147
147 -
 148
148 -
 149
149 -
 150
150 -
151
-
152
-
153
-
154
-
155
-
156
-
157
-
158
-
159
-
160
-
161
-
162
-
163
-
164
-
165
-
166
-
167
-
168
-
169
-
170
-
171
-
172
-
173
-
174
-
175
-
176
-
177
-
178
-
179
-
180
-
181
-
182
-
183
-
184
-
185
-
186
-
187
-
188
-
189
-
190
-
191
-
192
-
193
-
194
-
195
-
196
-
197
-
198
-
199
-
200
-
201
-
202
-
203
-
204
-
205
-
206
-
207
-
208
-
209
-
210
-
211
-
212
-
213
-
214
-
215
-
216
-
217
-
218
-
219
-
220
-
221
-
222
-
223
-
224
-
225
-
226
-
227
-
228
-
229
-
230
-
231
-
232
-
233
-
234
-
235
-
236
 |
 |
138 Annual Report 2014-2015
Schedules
forming part of the Accounts (Contd.)
Financial Statements of ICICI Bank Limited
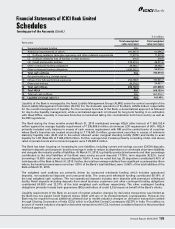
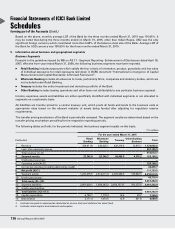
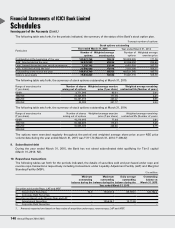
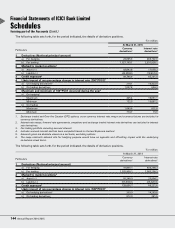
The following table sets forth, for the periods indicated, capital expenditure and depreciation thereon for the
geographical segments.
` in million
Capital expenditure incurred during Depreciation provided during
Year ended
March 31, 2015
Year ended
March 31, 2014
Year ended
March 31, 2015
Year ended
March 31, 2014
Domestic operations 7,203.7 6,357.7 6,539.1 5,710.7
Foreign operations 65.8 77.6 50.4 49.0
Total 7,269.5 6,435.3 6,589.5 5,759.7
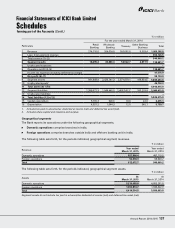
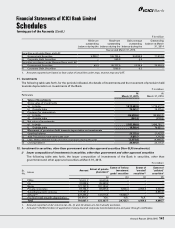
6. Maturity pattern
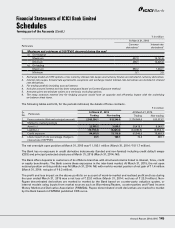
The following table sets forth, the maturity pattern of assets and liabilities of the Bank at March 31, 2015.
` in million
Maturity
buckets
Loans &
Advances1
Investment
securities1Deposits1Borrowings1,2 Total foreign
currency assets3
Total foreign
currency liabilities3
Day 1 13,214.3 141,697.8 41,567.5 598.0 151,131.3 4,647.3
2 to 7 days 16,158.5 141,036.3 119,412.1 84,014.6 14,229.3 14,626.4
8 to 14 days 25,935.4 78,590.9 75,983.5 24,794.1 28,086.5 18,353.3
15 to 28 days 63,509.3 112,192.5 95,239.7 29,923.7 50,989.7 27,824.4
29 days to 3 months 240,409.2 68,952.6 239,316.0 94,042.6 102,526.4 100,679.1
3 to 6 months 273,277.9 103,536.7 265,327.9 157,163.6 95,118.0 126,379.4
6 months to 1 year 403,853.0 242,846.2 335,020.7 264,608.5 84,371.5 234,962.4
1 to 3 years 1,563,199.5 186,318.4 533,335.7 384,309.3 360,253.4 486,870.8
3 to 5 years 592,051.6 274,314.4 976,972.0 217,966.7 193,476.2 205,960.2
Above 5 years 683,612.0 516,314.5 933,452.2 466,752.4 241,727.0 188,573.1
Total 3,875,220.7 1,865,800.3 3,615,627.3 1,724,173.5 1,321,909.3 1,408,876.4
1. Includes foreign currency balances.
2. Includes borrowings in the nature of subordinated debts and preference shares.
3. Excludes off-balance sheet assets and liabilities.
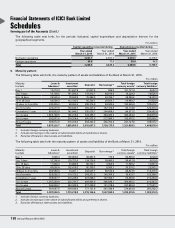
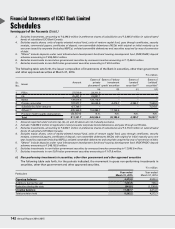
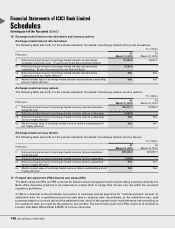
The following table sets forth the maturity pattern of assets and liabilities of the Bank at March 31, 2014.
` in million
Maturity
buckets
Loans &
Advances1
Investment
securities1Deposits1Borrowings1,2 Total foreign
currency assets3
Total foreign
currency liabilities3
Day 1 7,090.4 100,869.4 30,987.9 173.8 83,845.9 3,628.9
2 to 7 days 15,166.4 129,722.6 124,279.6 78,866.5 58,461.8 6,619.5
8 to 14 days 11,959.4 63,889.9 80,752.1 3,004.0 11,590.2 12,801.0
15 to 28 days 45,665.4 102,418.3 85,790.7 8,006.7 20,316.2 23,962.2
29 days to 3 months 200,983.8 74,321.1 232,027.7 99,579.6 94,827.5 114,376.6
3 to 6 months 253,002.3 110,122.2 243,371.3 165,350.3 79,410.7 152,308.7
6 months to 1 year 358,047.7 218,245.0 427,548.7 197,353.7 65,366.6 215,464.8
1 to 3 years 1,297,203.9 222,735.7 499,966.0 306,698.1 303,865.2 416,447.5
3 to 5 years 596,859.7 243,349.4 817,290.8 191,218.9 237,859.4 171,501.1
Above 5 years 601,047.5 504,544.6 777,121.8 497,338.9 279,832.0 265,202.2
Total 3,387,026.5 1,770,218.2 3,319,136.6 1,547,590.5 1,235,375.5 1,382,312.5
1. Includes foreign currency balances.
2. Includes borrowings in the nature of subordinated debts and preference shares.
3. Excludes off-balance sheet assets and liabilities.