ICICI Bank 2015 Annual Report Download - page 95
Download and view the complete annual report
Please find page 95 of the 2015 ICICI Bank annual report below. You can navigate through the pages in the report by either clicking on the pages listed below, or by using the keyword search tool below to find specific information within the annual report.-
 1
1 -
2
-
3
-
4
-
5
-
6
-
7
-
8
-
9
-
10
-
11
-
12
-
13
-
14
-
15
-
16
-
17
-
18
-
19
-
20
-
21
-
22
-
23
-
24
-
25
-
26
-
27
-
28
-
29
-
30
-
31
-
32
-
33
-
34
-
35
-
36
-
37
-
38
-
39
-
40
-
41
-
42
-
43
-
44
-
45
-
46
-
47
-
48
-
49
-
50
-
51
-
52
-
53
-
54
-
55
-
56
-
57
-
58
-
59
-
60
-
61
-
62
-
63
-
64
-
65
-
66
-
67
-
68
-
69
-
70
-
71
-
72
-
73
-
74
-
75
-
76
-
77
-
78
-
79
-
80
-
81
-
82
-
83
-
84
-
 85
85 -
 86
86 -
 87
87 -
 88
88 -
 89
89 -
 90
90 -
 91
91 -
 92
92 -
 93
93 -
 94
94 -
 95
95 -
 96
96 -
 97
97 -
 98
98 -
 99
99 -
 100
100 -
 101
101 -
 102
102 -
 103
103 -
 104
104 -
 105
105 -
106
-
107
-
108
-
109
-
110
-
111
-
112
-
113
-
114
-
115
-
116
-
117
-
118
-
119
-
120
-
121
-
122
-
123
-
124
-
125
-
126
-
127
-
128
-
129
-
130
-
131
-
132
-
133
-
134
-
135
-
136
-
137
-
138
-
139
-
140
-
141
-
142
-
143
-
144
-
145
-
146
-
147
-
148
-
149
-
150
-
151
-
152
-
153
-
154
-
155
-
156
-
157
-
158
-
159
-
160
-
161
-
162
-
163
-
164
-
165
-
166
-
167
-
168
-
169
-
170
-
171
-
172
-
173
-
174
-
175
-
176
-
177
-
178
-
179
-
180
-
181
-
182
-
183
-
184
-
185
-
186
-
187
-
188
-
189
-
190
-
191
-
192
-
193
-
194
-
195
-
196
-
197
-
198
-
199
-
200
-
201
-
202
-
203
-
204
-
205
-
206
-
207
-
208
-
209
-
210
-
211
-
212
-
213
-
214
-
215
-
216
-
217
-
218
-
219
-
220
-
221
-
222
-
223
-
224
-
225
-
226
-
227
-
228
-
229
-
230
-
231
-
232
-
233
-
234
-
235
-
236
 |
 |

93Annual Report 2014-2015
` 12.96 billion in fiscal 2014 to ` 15.59 billion in fiscal 2015. Fee income increased by 6.8% from ` 77.58 billion in fiscal
2014 to ` 82.87 billion in fiscal 2015.
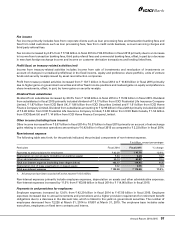
Non-interest expenses increased by 11.5% from ` 103.09 billion in fiscal 2014 to ` 114.96 billion in fiscal 2015 primarily
due to an increase in other administrative expenses. Provisions and contingencies (excluding provisions for tax) increased
by 48.5% from ` 26.26 billion in fiscal 2014 to ` 39.00 billion in fiscal 2015. The increase in provisions and contingencies
(excluding provisions for tax) was primarily due to additions to non-performing assets (including slippages from the
restructured asset portfolio) and restructured loans.
Total assets increased by 8.7% from ` 5,946.42 billion at March 31, 2014 to ` 6,461.29 billion at March 31, 2015.
Total deposits increased by 8.9% from ` 3,319.14 billion at March 31, 2014 to ` 3,615.63 billion at March 31, 2015.
Savings account deposits increased by 15.9% from ` 991.33 billion at March 31, 2014 to ` 1,148.60 billion at
March 31, 2015. Current account deposits increased by 14.5% from ` 432.45 billion at March 31, 2014 to ` 495.20 billion
at March 31, 2015. Term deposits increased by 4.0% from ` 1,895.35 billion at March 31, 2014 to ` 1,971.83 billion
at March 31, 2015. The current and savings account (CASA) ratio was 45.5% at March 31, 2015 compared to 42.9%
at March 31, 2014. Total advances increased by 14.4% from ` 3,387.03 billion at March 31, 2014 to ` 3,875.22 billion
at March 31, 2015 primarily due to an increase in domestic advances. The net NPA ratio increased from 0.82% at
March 31, 2014 to 1.40% at March 31, 2015.
The Bank continued to expand its branch network in India. The branch network of the Bank in India increased from 3,753
branches at March 31, 2014 to 4,050 branches at March 31, 2015. The ATM network of the Bank increased from 11,315
ATMs at March 31, 2014 to 12,451 ATMs at March 31, 2015.
The Bank is subject to the Basel III capital adequacy guidelines stipulated by RBI. The total capital adequacy ratio of the
Bank at March 31, 2015 in accordance with RBI guidelines on Basel III was 17.02% with a Tier-1 capital adequacy ratio of
12.78% as compared to 17.70% at March 31, 2014 with a Tier-1 capital adequacy ratio of 12.78%.
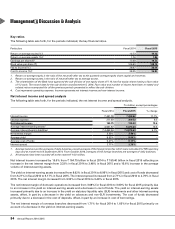
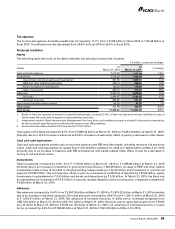
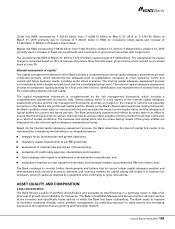
Operating results data
The following table sets forth, for the periods indicated, the operating results data.
` in billion, except percentages
Particulars Fiscal 2014 Fiscal 2015 % change
Interest income ` 441.78 ` 490.92 11.1%
Interest expense 277.03 300.52 8.5
Net interest income 164.75 190.40 15.6
Non-interest income
- Fee income177.58 82.87 6.8
- Treasury income 10.17 16.93 66.5
- Dividend from subsidiaries 12.96 15.59 20.3
- Other income (including lease income)23.57 6.37 78.4
Operating income 269.03 312.16 16.0
Operating expenses 103.09 114.96 11.5
Operating profit 165.94 197.20 18.8
Provisions, net of write-backs 26.26 39.00 48.5
Profit before tax 139.68 158.20 13.3
Tax, including deferred tax 41.58 46.45 11.7
Profit after tax ` 98.10 ` 111.75 13.9%
1. Includes merchant foreign exchange income and margin on customer derivative transactions.
2. Includes exchange gains related to overseas operations.
3. All amounts have been rounded off to the nearest ` 10.0 million.
4. Prior period figures have been re-grouped/re-arranged, where necessary.