ICICI Bank 2015 Annual Report Download - page 166
Download and view the complete annual report
Please find page 166 of the 2015 ICICI Bank annual report below. You can navigate through the pages in the report by either clicking on the pages listed below, or by using the keyword search tool below to find specific information within the annual report.-
 1
1 -
2
-
3
-
4
-
5
-
6
-
7
-
8
-
9
-
10
-
11
-
12
-
13
-
14
-
15
-
16
-
17
-
18
-
19
-
20
-
21
-
22
-
23
-
24
-
25
-
26
-
27
-
28
-
29
-
30
-
31
-
32
-
33
-
34
-
35
-
36
-
37
-
38
-
39
-
40
-
41
-
42
-
43
-
44
-
45
-
46
-
47
-
48
-
49
-
50
-
51
-
52
-
53
-
54
-
55
-
56
-
57
-
58
-
59
-
60
-
61
-
62
-
63
-
64
-
65
-
66
-
67
-
68
-
69
-
70
-
71
-
72
-
73
-
74
-
75
-
76
-
77
-
78
-
79
-
80
-
81
-
82
-
83
-
84
-
85
-
86
-
87
-
88
-
89
-
90
-
91
-
92
-
93
-
94
-
95
-
96
-
97
-
98
-
99
-
100
-
101
-
102
-
103
-
104
-
105
-
106
-
107
-
108
-
109
-
110
-
111
-
112
-
113
-
114
-
115
-
116
-
117
-
118
-
119
-
120
-
121
-
122
-
123
-
124
-
125
-
126
-
127
-
128
-
129
-
130
-
131
-
132
-
133
-
134
-
135
-
136
-
137
-
138
-
139
-
140
-
141
-
142
-
143
-
144
-
145
-
146
-
147
-
148
-
149
-
150
-
151
-
152
-
153
-
154
-
155
-
 156
156 -
 157
157 -
 158
158 -
 159
159 -
 160
160 -
 161
161 -
 162
162 -
 163
163 -
 164
164 -
 165
165 -
 166
166 -
 167
167 -
 168
168 -
 169
169 -
 170
170 -
 171
171 -
 172
172 -
 173
173 -
 174
174 -
 175
175 -
 176
176 -
177
-
178
-
179
-
180
-
181
-
182
-
183
-
184
-
185
-
186
-
187
-
188
-
189
-
190
-
191
-
192
-
193
-
194
-
195
-
196
-
197
-
198
-
199
-
200
-
201
-
202
-
203
-
204
-
205
-
206
-
207
-
208
-
209
-
210
-
211
-
212
-
213
-
214
-
215
-
216
-
217
-
218
-
219
-
220
-
221
-
222
-
223
-
224
-
225
-
226
-
227
-
228
-
229
-
230
-
231
-
232
-
233
-
234
-
235
-
236
 |
 |

164 Annual Report 2014-2015
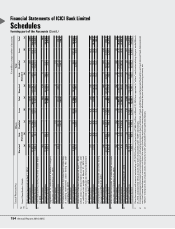
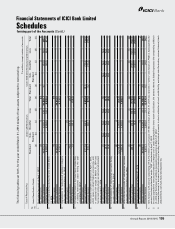
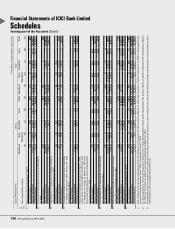
Schedules
forming part of the Accounts (Contd.)
Financial Statements of ICICI Bank Limited
` in million
Particulars Year ended
March 31, 2015
Year ended
March 31, 2014
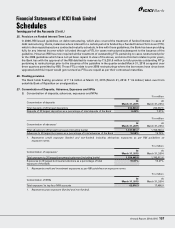
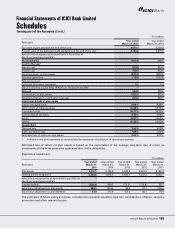
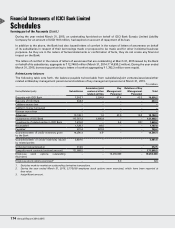
Assumptions
Discount rate 8.00% 9.25%
Salary escalation rate:
On Basic pay 1.50% 1.50%
On Dearness relief 7.00% 7.00%
Estimated rate of return on plan assets 8.00% 8.00%
1. Included in line item payments to and provision for employees of Schedule-16 Operating expenses.
2. Majority of the funds are invested in Government of India securities and corporate bonds.
Estimated rate of return on plan assets is based on our expectation of the average long-term rate of return on
investments of the Fund during the estimated term of the obligations.
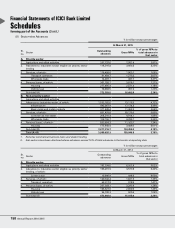
Experience adjustment
` in million
Particulars
Year ended
March 31,
2015
Year ended
March 31,
2014
Year ended
March 31,
2013
Year ended
March 31,
2012
Year ended
March 31,
2011
Plan assets 10,103.4 9,018.8 9,526.8 9,379.5 8,467.4
Defined benefit obligations 12,999.9 10,209.9 10,392.5 9,602.7 8,842.9
Amount not recognised as an asset (limit in para 59(b)
of AS-15 on ‘employee benefits’)
– – – – –
Surplus/(deficit) (2,896.5) (1,191.1) (865.7) (223.2) (375.5)
Experience adjustment on plan assets 104.7 (29.1) 102.3 51.7 69.1
Experience adjustment on plan liabilities 1,271.2 2,549.6 1,525.2 2,692.3 689.7
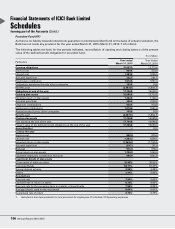
Gratuity
The following tables set forth, for the periods indicated, movement of the present value of the defined benefit obligation, fair value
of plan assets and other details for gratuity benefits.
` in million
Particulars Year ended
March 31, 2015
Year ended
March 31, 2014
Opening obligations 5,818.5 5,643.1
Add: adjustment for exchange fluctuation on opening obligations 3.1 5.8
Adjusted opening obligations 5,821.6 5,648.9
Service cost 529.8 473.6
Interest cost 529.9 453.6
Actuarial (gain)/loss 514.3 (135.4)
Past service cost ––
Liability transferred from/to other companies (7.3) (6.2)
Benefits paid (633.7) (616.0)
Obligations at the end of the year 6,754.6 5,818.5
Opening plan assets, at fair value 5,729.9 5,530.5
Expected return on plan assets 443.5 426.5
Actuarial gain/(loss) 589.1 (29.5)
Contributions 449.2 424.6
Asset transferred from/to other companies (7.3) (6.2)
Benefits paid (633.5) (616.0)
Closing plan assets, at fair value 6,570.7 5,729.9