ICICI Bank 2015 Annual Report Download - page 136
Download and view the complete annual report
Please find page 136 of the 2015 ICICI Bank annual report below. You can navigate through the pages in the report by either clicking on the pages listed below, or by using the keyword search tool below to find specific information within the annual report.-
 1
1 -
2
-
3
-
4
-
5
-
6
-
7
-
8
-
9
-
10
-
11
-
12
-
13
-
14
-
15
-
16
-
17
-
18
-
19
-
20
-
21
-
22
-
23
-
24
-
25
-
26
-
27
-
28
-
29
-
30
-
31
-
32
-
33
-
34
-
35
-
36
-
37
-
38
-
39
-
40
-
41
-
42
-
43
-
44
-
45
-
46
-
47
-
48
-
49
-
50
-
51
-
52
-
53
-
54
-
55
-
56
-
57
-
58
-
59
-
60
-
61
-
62
-
63
-
64
-
65
-
66
-
67
-
68
-
69
-
70
-
71
-
72
-
73
-
74
-
75
-
76
-
77
-
78
-
79
-
80
-
81
-
82
-
83
-
84
-
85
-
86
-
87
-
88
-
89
-
90
-
91
-
92
-
93
-
94
-
95
-
96
-
97
-
98
-
99
-
100
-
101
-
102
-
103
-
104
-
105
-
106
-
107
-
108
-
109
-
110
-
111
-
112
-
113
-
114
-
115
-
116
-
117
-
118
-
119
-
120
-
121
-
122
-
123
-
124
-
125
-
 126
126 -
 127
127 -
 128
128 -
 129
129 -
 130
130 -
 131
131 -
 132
132 -
 133
133 -
 134
134 -
 135
135 -
 136
136 -
 137
137 -
 138
138 -
 139
139 -
 140
140 -
 141
141 -
 142
142 -
 143
143 -
 144
144 -
 145
145 -
 146
146 -
147
-
148
-
149
-
150
-
151
-
152
-
153
-
154
-
155
-
156
-
157
-
158
-
159
-
160
-
161
-
162
-
163
-
164
-
165
-
166
-
167
-
168
-
169
-
170
-
171
-
172
-
173
-
174
-
175
-
176
-
177
-
178
-
179
-
180
-
181
-
182
-
183
-
184
-
185
-
186
-
187
-
188
-
189
-
190
-
191
-
192
-
193
-
194
-
195
-
196
-
197
-
198
-
199
-
200
-
201
-
202
-
203
-
204
-
205
-
206
-
207
-
208
-
209
-
210
-
211
-
212
-
213
-
214
-
215
-
216
-
217
-
218
-
219
-
220
-
221
-
222
-
223
-
224
-
225
-
226
-
227
-
228
-
229
-
230
-
231
-
232
-
233
-
234
-
235
-
236
 |
 |

134 Annual Report 2014-2015
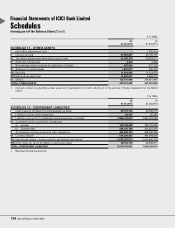
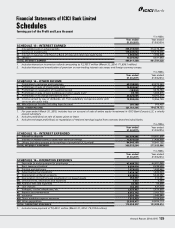
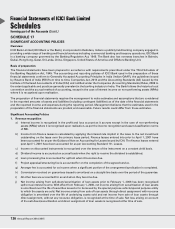
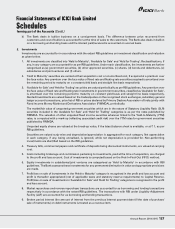
Schedules
forming part of the Accounts (Contd.)
Financial Statements of ICICI Bank Limited
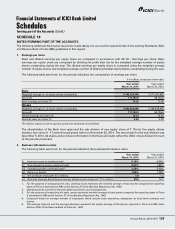
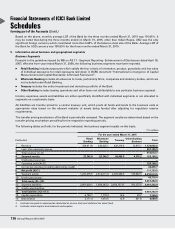
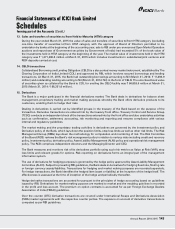
3. Capital adequacy ratio
The Bank is subject to the Basel III capital adequacy guidelines stipulated by RBI with effect from April 1, 2013. The
guidelines provide a transition schedule for Basel III implementation till March 31, 2019. As per the guidelines, the
Tier-1 capital is made up of Common Equity Tier-1 (CET1) and Additional Tier-1.
At March 31, 2015, Basel III guidelines require the Bank to maintain a minimum capital to risk-weighted assets ratio
(CRAR) of 9.0% with minimum CET1 CRAR of 5.5% and minimum Tier-1 CRAR of 7.0%.
The following table sets forth, for the period indicated, computation of capital adequacy as per Basel III framework.
` in million, except percentages
At
March 31, 2015
At
March 31, 2014
Common Equity Tier 1 CRAR (%) 12.78% 12.78%
Tier-1 CRAR (%) 12.78% 12.78%
Tier-2 CRAR (%) 4.24% 4.92%
Total CRAR (%) 17.02% 17.70%
Amount of equity capital raised ––
Amount of Additional Tier-1 capital raised; of which
Perpetual Non-Cumulative Preference Shares ––
Perpetual Debt Instruments ––
Amount of Tier-2 capital raised; of which
Debt capital instrument ––
Preference Share Capital Instruments ––
[Perpetual Cumulative Preference Shares (PCPS)/Redeemable Non-Cumulative
Preference Shares (RNCPS)/Redeemable Cumulative Preference Shares (RCPS)]
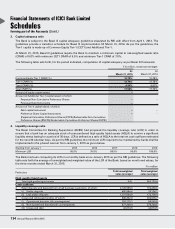
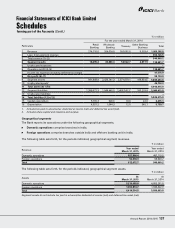
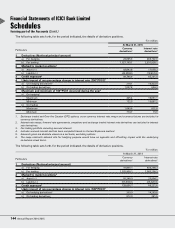
4. Liquidity coverage ratio
The Basel Committee for Banking Supervision (BCBS) had proposed the liquidity coverage ratio (LCR) in order to
ensure that a bank has an adequate stock of unencumbered high quality liquid assets (HQLA) to survive a significant
liquidity stress lasting for a period of 30 days. LCR is defined as a ratio of HQLA to the total net cash outflows estimated
for the next 30 calendar days. As per the RBI guidelines the minimum LCR required to be maintained by banks shall be
implemented in the phased manner from January 1, 2015 as given below.
Starting from January 1 2015 2016 2017 2018 2019
Minimum LCR 60.0% 70.0% 80.0% 90.0% 100.0%
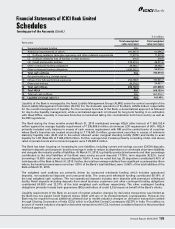
The Bank has been computing its LCR on a monthly basis since January 2015 as per the RBI guidelines. The following
table sets forth the average of unweighted and weighted value of the LCR of the Bank, based on month end values, for
the three months ended March 31, 2015.
` in million
Particulars Total unweighted
value (average)
Total weighted
value (average)
High quality liquid assets
1 Total high quality liquid assets N.A. 569,153.4
Cash outflows
2 Retail deposits and deposits from small business customers, of which: 2,126,588.6 192,404.6
(i) Stable deposits 405,084.6 20,254.2
(ii) Less stable deposits 1,721,504.0 172,150.4
3 Unsecured wholesale funding, of which: 840,202.0 392,978.7
(i) Operational deposits (all counterparties) 320,279.2 80,069.8
(ii) Non-operational deposits (all counterparties) 477,248.4 270,234.5
(iii) Unsecured debt 42,674.5 42,674.5