ICICI Bank 2015 Annual Report Download - page 143
Download and view the complete annual report
Please find page 143 of the 2015 ICICI Bank annual report below. You can navigate through the pages in the report by either clicking on the pages listed below, or by using the keyword search tool below to find specific information within the annual report.-
 1
1 -
2
-
3
-
4
-
5
-
6
-
7
-
8
-
9
-
10
-
11
-
12
-
13
-
14
-
15
-
16
-
17
-
18
-
19
-
20
-
21
-
22
-
23
-
24
-
25
-
26
-
27
-
28
-
29
-
30
-
31
-
32
-
33
-
34
-
35
-
36
-
37
-
38
-
39
-
40
-
41
-
42
-
43
-
44
-
45
-
46
-
47
-
48
-
49
-
50
-
51
-
52
-
53
-
54
-
55
-
56
-
57
-
58
-
59
-
60
-
61
-
62
-
63
-
64
-
65
-
66
-
67
-
68
-
69
-
70
-
71
-
72
-
73
-
74
-
75
-
76
-
77
-
78
-
79
-
80
-
81
-
82
-
83
-
84
-
85
-
86
-
87
-
88
-
89
-
90
-
91
-
92
-
93
-
94
-
95
-
96
-
97
-
98
-
99
-
100
-
101
-
102
-
103
-
104
-
105
-
106
-
107
-
108
-
109
-
110
-
111
-
112
-
113
-
114
-
115
-
116
-
117
-
118
-
119
-
120
-
121
-
122
-
123
-
124
-
125
-
126
-
127
-
128
-
129
-
130
-
131
-
132
-
 133
133 -
 134
134 -
 135
135 -
 136
136 -
 137
137 -
 138
138 -
 139
139 -
 140
140 -
 141
141 -
 142
142 -
 143
143 -
 144
144 -
 145
145 -
 146
146 -
 147
147 -
 148
148 -
 149
149 -
 150
150 -
 151
151 -
 152
152 -
 153
153 -
154
-
155
-
156
-
157
-
158
-
159
-
160
-
161
-
162
-
163
-
164
-
165
-
166
-
167
-
168
-
169
-
170
-
171
-
172
-
173
-
174
-
175
-
176
-
177
-
178
-
179
-
180
-
181
-
182
-
183
-
184
-
185
-
186
-
187
-
188
-
189
-
190
-
191
-
192
-
193
-
194
-
195
-
196
-
197
-
198
-
199
-
200
-
201
-
202
-
203
-
204
-
205
-
206
-
207
-
208
-
209
-
210
-
211
-
212
-
213
-
214
-
215
-
216
-
217
-
218
-
219
-
220
-
221
-
222
-
223
-
224
-
225
-
226
-
227
-
228
-
229
-
230
-
231
-
232
-
233
-
234
-
235
-
236
 |
 |

141Annual Report 2014-2015
forming part of the Accounts (Contd.)
Schedules
Financial Statements of ICICI Bank Limited
` in million
Minimum
outstanding
balance during the
Maximum
outstanding
balance during the
Daily average
outstanding
balance during the
Outstanding
balance at March
31, 2014
Year ended March 31, 2014
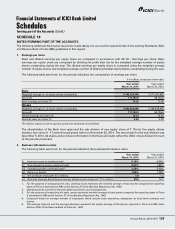
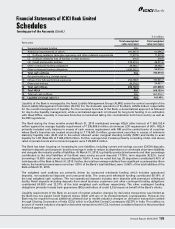
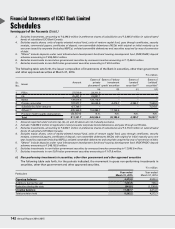
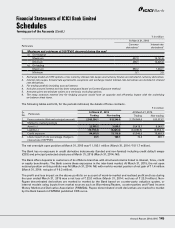
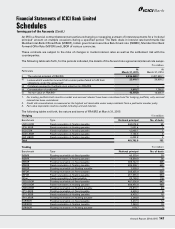
Securities sold under Repo and LAF
i) Government Securities 5,003.7 199,735.6 84,099.8 71,810.8
ii) Corporate Debt Securities – 550.0 3.2 –
Securities purchased under Reverse Repo and LAF
i) Government Securities 43.3 50,227.0 5,978.8 29,955.9
ii) Corporate Debt Securities – 1,050.0 6.2 –
1. Amounts reported are based on face value of securities under repo, reverse repo and LAF.
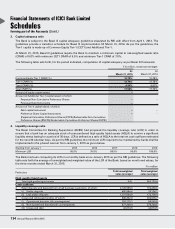
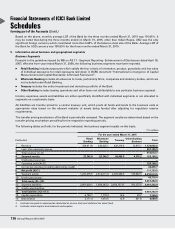
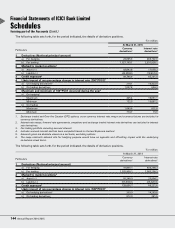
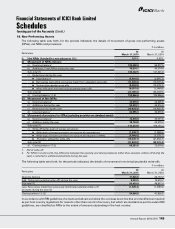
11. Investments
The following table sets forth, for the periods indicated, the details of investments and the movement of provision held
towards depreciation on investments of the Bank.
` in million
Particulars At
March 31, 2015
At
March 31, 2014
1. Value of Investments
i) Gross value of investments
a) In India 1,813,593.6 1,719,617.3
b) Outside India 79,061.7 74,375.9
ii) Provision for depreciation
c) In India (26,293.6) (23,456.2)
d) Outside India (561.3) (318.8)
iii) Net value of investments
e) In India 1,787,300.0 1,696,161.1
f) Outside India 78,500.4 74,057.1
2. Movement of provisions held towards depreciation on investments
i) Opening balance 23,775.0 27,623.0
ii) Add: Provisions made during the year 5,631.7 1,112.8
iii) Less: Write-off/(write-back) of excess provisions during the year (2,551.8) (4,960.8)
iv) Closing balance 26,854.9 23,775.0
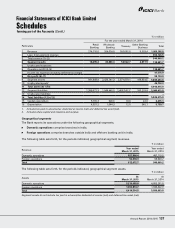
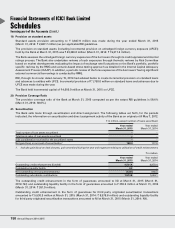
12. Investment in securities, other than government and other approved securities (Non-SLR investments)
i) Issuer composition of investments in securities, other than government and other approved securities
The following table sets forth, the issuer composition of investments of the Bank in securities, other than
government and other approved securities at March 31, 2015.
` in million
Sr.
No. Issuer Amount Extent of private
placement2
Extent of ‘below
investment
grade’ securities
Extent of
‘unrated’
securities3,4
Extent of
‘unlisted’
securities4
(a) (b) (c) (d)
1 PSUs 16,011.7 10,870.8 – – –
2 FIs 37,028.6 25,340.3 – – –
3 Banks 121,737.0 107,104.2 – – –
4 Private corporates 97,754.7 88,835.8 7,836.4 4,054.6 3,032.8
5 Subsidiaries/Joint ventures 117,751.2 – – – 6,861.9
6 Others5,6,7 427,259.2 141,016.6 16,888.7 – –
7 Provision held towards depreciation (25,674.7) N.A. N.A. N.A. N.A.
Total 791,867.7 373,167.7 24,725.1 4,054.6 9,894.7
1. Amounts reported under columns (a), (b), (c) and (d) above are not mutually exclusive.
2. Includes ` 33,050.4 million of application money towards corporate bonds/debentures and pass through certificates.