ICICI Bank 2015 Annual Report Download - page 106
Download and view the complete annual report
Please find page 106 of the 2015 ICICI Bank annual report below. You can navigate through the pages in the report by either clicking on the pages listed below, or by using the keyword search tool below to find specific information within the annual report.-
 1
1 -
 2
2 -
 3
3 -
 4
4 -
 5
5 -
 6
6 -
 7
7 -
 8
8 -
 9
9 -
 10
10 -
 11
11 -
 12
12 -
 13
13 -
 14
14 -
 15
15 -
 16
16 -
 17
17 -
 18
18 -
 19
19 -
 20
20 -
 21
21 -
 22
22 -
 23
23 -
 24
24 -
 25
25 -
 26
26 -
 27
27 -
 28
28 -
 29
29 -
 30
30 -
 31
31 -
 32
32 -
 33
33 -
 34
34 -
 35
35 -
 36
36 -
 37
37 -
 38
38 -
 39
39 -
 40
40 -
 41
41 -
 42
42 -
 43
43 -
 44
44 -
 45
45 -
 46
46 -
 47
47 -
 48
48 -
 49
49 -
 50
50 -
 51
51 -
 52
52 -
 53
53 -
 54
54 -
 55
55 -
 56
56 -
 57
57 -
 58
58 -
 59
59 -
 60
60 -
 61
61 -
 62
62 -
 63
63 -
 64
64 -
 65
65 -
 66
66 -
 67
67 -
 68
68 -
 69
69 -
 70
70 -
 71
71 -
 72
72 -
 73
73 -
 74
74 -
 75
75 -
 76
76 -
 77
77 -
 78
78 -
 79
79 -
 80
80 -
 81
81 -
 82
82 -
 83
83 -
 84
84 -
 85
85 -
 86
86 -
 87
87 -
 88
88 -
 89
89 -
 90
90 -
 91
91 -
 92
92 -
 93
93 -
 94
94 -
 95
95 -
 96
96 -
 97
97 -
 98
98 -
 99
99 -
 100
100 -
 101
101 -
 102
102 -
 103
103 -
 104
104 -
 105
105 -
 106
106 -
 107
107 -
 108
108 -
 109
109 -
 110
110 -
 111
111 -
 112
112 -
 113
113 -
 114
114 -
 115
115 -
 116
116 -
 117
117 -
 118
118 -
 119
119 -
 120
120 -
 121
121 -
 122
122 -
 123
123 -
 124
124 -
 125
125 -
 126
126 -
 127
127 -
 128
128 -
 129
129 -
 130
130 -
 131
131 -
 132
132 -
 133
133 -
 134
134 -
 135
135 -
 136
136 -
 137
137 -
 138
138 -
 139
139 -
 140
140 -
 141
141 -
 142
142 -
 143
143 -
 144
144 -
 145
145 -
 146
146 -
 147
147 -
 148
148 -
 149
149 -
 150
150 -
 151
151 -
 152
152 -
 153
153 -
 154
154 -
 155
155 -
 156
156 -
 157
157 -
 158
158 -
 159
159 -
 160
160 -
 161
161 -
 162
162 -
 163
163 -
 164
164 -
 165
165 -
 166
166 -
 167
167 -
 168
168 -
 169
169 -
 170
170 -
 171
171 -
 172
172 -
 173
173 -
 174
174 -
 175
175 -
 176
176 -
 177
177 -
 178
178 -
 179
179 -
 180
180 -
 181
181 -
 182
182 -
 183
183 -
 184
184 -
 185
185 -
 186
186 -
 187
187 -
 188
188 -
 189
189 -
 190
190 -
 191
191 -
 192
192 -
 193
193 -
 194
194 -
 195
195 -
 196
196 -
 197
197 -
 198
198 -
 199
199 -
 200
200 -
 201
201 -
 202
202 -
 203
203 -
 204
204 -
 205
205 -
 206
206 -
 207
207 -
 208
208 -
 209
209 -
 210
210 -
 211
211 -
 212
212 -
 213
213 -
 214
214 -
 215
215 -
 216
216 -
 217
217 -
 218
218 -
 219
219 -
 220
220 -
 221
221 -
 222
222 -
 223
223 -
 224
224 -
 225
225 -
 226
226 -
 227
227 -
 228
228 -
 229
229 -
 230
230 -
 231
231 -
 232
232 -
 233
233 -
 234
234 -
 235
235 -
 236
236
 |
 |

Management’s Discussion & Analysis
104 Annual Report 2014-2015
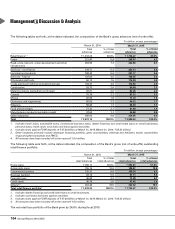
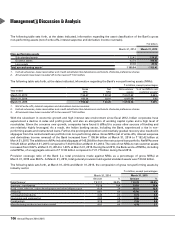
The following tables set forth, at the dates indicated, the composition of the Bank’s gross advances (net of write-offs).
` in billion, except percentages
March 31, 2014 March 31, 2015
Total
advances
% of total
advances
Total
advances
% of total
advances
Retail finance1, 2 ` 1,418.23 40.8% ` 1,736.27 43.5%
Power 221.43 6.4 248.07 6.2
Road, ports, telecom, urban development and other
infrastructure
253.96 7.3 244.96 6.1
Services – non-finance 218.77 6.3 233.13 5.8
Iron/steel and products 188.32 5.4 221.17 5.6
Services – finance 122.00 3.5 129.25 3.2
Wholesale/retail trade 66.13 1.9 116.59 2.9
Crude petroleum/refining and petrochemicals 103.47 3.0 114.56 2.9
Construction 83.75 2.4 99.98 2.5
Metal & products (excluding iron & steel) 69.01 2.0 92.26 2.3
Cement 76.74 2.2 91.31 2.3
Mining 60.96 1.8 71.10 1.8
Electronics and engineering 80.09 2.3 69.22 1.7
Shipping 59.46 1.7 66.03 1.7
Food and beverages 71.25 2.1 61.69 1.6
Manufacturing products (excluding metal) 37.63 1.1 34.98 0.9
Other industries3340.92 9.8 359.05 9.0
Total ` 3,472.12 100.0% ` 3,989.62 100.0%
1. Includes home loans, automobile loans, commercial business loans, dealer financing and small ticket loans to small businesses,
personal loans, credit cards, rural loans and loans against securities.
2. Includes loans against FCNR deposits of ` 67.84 billion at March 31, 2015 (March 31, 2014: ` 65.03 billion).
3. Other industries primarily include developer financing portfolio, gems and jewellery, chemical and fertilizers, textile, automobiles,
drugs and pharmaceuticals and FMCG.
4. All amounts have been rounded off to the nearest ` 10.0 million.
The following table sets forth, at the dates indicated, the composition of the Bank’s gross (net of write-offs) outstanding
retail finance portfolio.
` in billion, except percentages
March 31, 2014 March 31, 2015
Total
retail advances
% of total
retail advances
Total
retail advances
% of total
retail advances
Home loans ` 709.17 50.0% ` 894.81 51.6%
Automobile loans 155.15 10.9 189.97 10.9
Commercial business 125.31 8.8 109.36 6.3
Business banking183.10 5.9 97.11 5.6
Personal loans 46.90 3.3 71.28 4.1
Credit cards 36.16 2.6 41.42 2.4
Others2, 3 262.44 18.5 332.32 19.1
Total retail finance portfolio3` 1,418.23 100.0% ` 1,736.27 100.0%
1. Includes dealer financing and small ticket loans to small businesses.
2. Includes rural loans and loans against securities.
3. Includes loans against FCNR deposits of ` 67.84 billion at March 31, 2015 (March 31, 2014: ` 65.03 billion).
4. All amounts have been rounded off to the nearest ` 10.0 million.
The net retail loan portfolio of the Bank grew by 24.6% during fiscal 2015.
