ICICI Bank 2015 Annual Report Download - page 135
Download and view the complete annual report
Please find page 135 of the 2015 ICICI Bank annual report below. You can navigate through the pages in the report by either clicking on the pages listed below, or by using the keyword search tool below to find specific information within the annual report.-
 1
1 -
2
-
3
-
4
-
5
-
6
-
7
-
8
-
9
-
10
-
11
-
12
-
13
-
14
-
15
-
16
-
17
-
18
-
19
-
20
-
21
-
22
-
23
-
24
-
25
-
26
-
27
-
28
-
29
-
30
-
31
-
32
-
33
-
34
-
35
-
36
-
37
-
38
-
39
-
40
-
41
-
42
-
43
-
44
-
45
-
46
-
47
-
48
-
49
-
50
-
51
-
52
-
53
-
54
-
55
-
56
-
57
-
58
-
59
-
60
-
61
-
62
-
63
-
64
-
65
-
66
-
67
-
68
-
69
-
70
-
71
-
72
-
73
-
74
-
75
-
76
-
77
-
78
-
79
-
80
-
81
-
82
-
83
-
84
-
85
-
86
-
87
-
88
-
89
-
90
-
91
-
92
-
93
-
94
-
95
-
96
-
97
-
98
-
99
-
100
-
101
-
102
-
103
-
104
-
105
-
106
-
107
-
108
-
109
-
110
-
111
-
112
-
113
-
114
-
115
-
116
-
117
-
118
-
119
-
120
-
121
-
122
-
123
-
124
-
 125
125 -
 126
126 -
 127
127 -
 128
128 -
 129
129 -
 130
130 -
 131
131 -
 132
132 -
 133
133 -
 134
134 -
 135
135 -
 136
136 -
 137
137 -
 138
138 -
 139
139 -
 140
140 -
 141
141 -
 142
142 -
 143
143 -
 144
144 -
 145
145 -
146
-
147
-
148
-
149
-
150
-
151
-
152
-
153
-
154
-
155
-
156
-
157
-
158
-
159
-
160
-
161
-
162
-
163
-
164
-
165
-
166
-
167
-
168
-
169
-
170
-
171
-
172
-
173
-
174
-
175
-
176
-
177
-
178
-
179
-
180
-
181
-
182
-
183
-
184
-
185
-
186
-
187
-
188
-
189
-
190
-
191
-
192
-
193
-
194
-
195
-
196
-
197
-
198
-
199
-
200
-
201
-
202
-
203
-
204
-
205
-
206
-
207
-
208
-
209
-
210
-
211
-
212
-
213
-
214
-
215
-
216
-
217
-
218
-
219
-
220
-
221
-
222
-
223
-
224
-
225
-
226
-
227
-
228
-
229
-
230
-
231
-
232
-
233
-
234
-
235
-
236
 |
 |

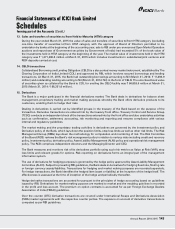
133Annual Report 2014-2015
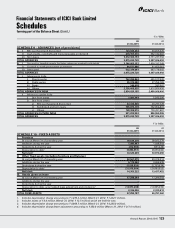
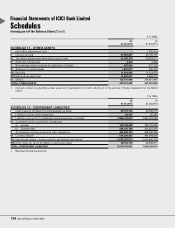
forming part of the Accounts (Contd.)
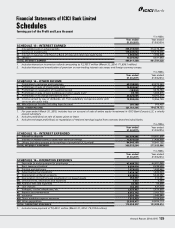
Schedules
Financial Statements of ICICI Bank Limited
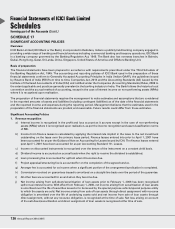
SCHEDULE 18
NOTES FORMING PART OF THE ACCOUNTS
The following additional disclosures have been made taking into account the requirements of Accounting Standards (ASs)
and Reserve Bank of India (RBI) guidelines in this regard.
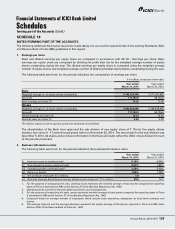
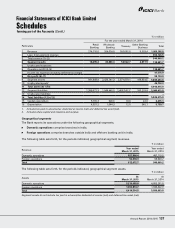
1. Earnings per share
Basic and diluted earnings per equity share are computed in accordance with AS 20 – Earnings per share. Basic
earnings per equity share are computed by dividing net profit after tax by the weighted average number of equity
shares outstanding during the year. The diluted earnings per equity share is computed using the weighted average
number of equity shares and weighted average number of dilutive potential equity shares outstanding during the year.
The following table sets forth, for the periods indicated, the computation of earnings per share.
` in million, except per share data
Year ended
March 31, 2015
Year ended
March 31, 2014
Basic
Weighted average no. of equity shares outstanding 5,785,726,485 5,771,587,885
Net profit 111,753.5 98,104.8
Basic earnings per share (`)19.32 17.00
Diluted
Weighted average no. of equity shares outstanding 5,842,092,456 5,794,468,950
Net profit 111,753.5 98,104.8
Diluted earnings per share (`)19.13 16.93
Nominal value per share (`)2.00 2.00
The dilutive impact is due to options granted to employees by the Bank.
The shareholders of the Bank have approved the sub-division of one equity share of ` 10 into five equity shares
having a face value of ` 2 each through postal ballot on November 20, 2014. The record date for the sub-division was
December 5, 2014. All shares and per share information in the financial results reflect the effect of sub-division for each
of the periods presented.
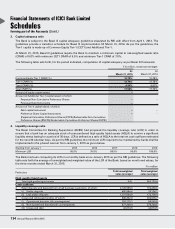
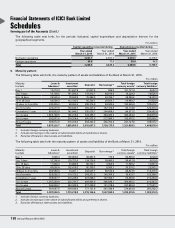
2. Business/information ratios
The following table sets forth, for the periods indicated, the business/information ratios.
Year ended
March 31, 2015
Year ended
March 31, 2014
(i) Interest income to working funds18.19% 8.00%
(ii) Non-interest income to working funds12.03% 1.89%
(iii) Operating profit to working funds1,2 3.29% 3.00%
(iv) Return on assets31.86% 1.78%
(v) Net profit per employee4 (` in million) 1.6 1.4
(vi) Business (average deposits plus average advances) per employee4,5 (` in million) 83.2 74.7
1. For the purpose of computing the ratio, working funds represent the monthly average of total assets computed for reporting
dates of Form X submitted to RBI under Section 27 of the Banking Regulation Act, 1949.
2. Operating profit is profit for the year before provisions and contingencies.
3. For the purpose of computing the ratio, assets represent monthly average of total assets computed for reporting dates of Form
X submitted to RBI under Section 27 of the Banking Regulation Act, 1949.
4. Computed based on average number of employees which include sales executives, employees on fixed term contracts and
interns.
5. The average deposits and the average advances represent the simple average of the figures reported in Form A to RBI under
Section 42(2) of the Reserve Bank of India Act, 1934.