Food Lion 2013 Annual Report Download - page 94
Download and view the complete annual report
Please find page 94 of the 2013 Food Lion annual report below. You can navigate through the pages in the report by either clicking on the pages listed below, or by using the keyword search tool below to find specific information within the annual report.-
 1
1 -
2
-
3
-
4
-
5
-
6
-
7
-
8
-
9
-
10
-
11
-
12
-
13
-
14
-
15
-
16
-
17
-
18
-
19
-
20
-
21
-
22
-
23
-
24
-
25
-
26
-
27
-
28
-
29
-
30
-
31
-
32
-
33
-
34
-
35
-
36
-
37
-
38
-
39
-
40
-
41
-
42
-
43
-
44
-
45
-
46
-
47
-
48
-
49
-
50
-
51
-
52
-
53
-
54
-
55
-
56
-
57
-
58
-
59
-
60
-
61
-
62
-
63
-
64
-
65
-
66
-
67
-
68
-
69
-
70
-
71
-
72
-
73
-
74
-
75
-
76
-
77
-
78
-
79
-
80
-
81
-
82
-
83
-
 84
84 -
 85
85 -
 86
86 -
 87
87 -
 88
88 -
 89
89 -
 90
90 -
 91
91 -
 92
92 -
 93
93 -
 94
94 -
 95
95 -
 96
96 -
 97
97 -
 98
98 -
 99
99 -
 100
100 -
 101
101 -
 102
102 -
 103
103 -
 104
104 -
105
-
106
-
107
-
108
-
109
-
110
-
111
-
112
-
113
-
114
-
115
-
116
-
117
-
118
-
119
-
120
-
121
-
122
-
123
-
124
-
125
-
126
-
127
-
128
-
129
-
130
-
131
-
132
-
133
-
134
-
135
-
136
-
137
-
138
-
139
-
140
-
141
-
142
-
143
-
144
-
145
-
146
-
147
-
148
-
149
-
150
-
151
-
152
-
153
-
154
-
155
-
156
-
157
-
158
-
159
-
160
-
161
-
162
-
163
-
164
-
165
-
166
-
167
-
168
-
169
-
170
-
171
-
172
-
173
-
174
-
175
-
176
 |
 |

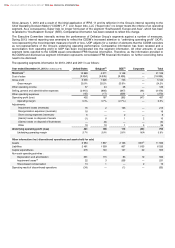
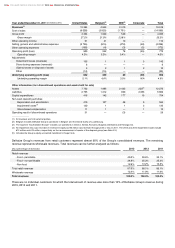
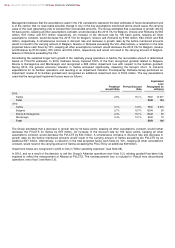
Since January 1, 2013 and a result of the initial application of IFRS 11 and its reflection in the Group’s internal reporting to the
Chief Operating Decision Maker (“CODM”), P.T. Lion Super Indo, LLC (“Super Indo”) no longer meets the criteria of an operating
segment. As a consequence, Super Indo no longer forms part of the segment “Southeastern Europe and Asia”, which has been
re-labeled to “Southeastern Europe” (SEE). Comparative information has been restated to reflect this change.
The Executive Committee internally reviews the performance of Delhaize Group’s segments against a number of measures.
During 2013, internal reporting was amended to reflect the CODM’s increased attention to “underlying operating profit” (UOP),
now representing the most important measure of profit or loss. UOP adjusts for a number of elements that the CODM considers
as non-representative of the Group’s underlying operating performance. Comparative information has been restated and a
reconciliation from operating profit to UOP has been incorporated into the segment information. All other amounts of each
segment items reported to the CODM equal consolidated IFRS financial information. Therefore, as the information provided to
the CODM and disclosed as segment information represents consolidated IFRS financial information, no further reconciling items
need to be disclosed.
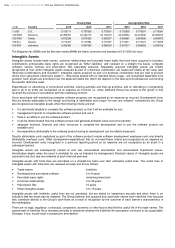
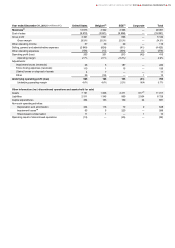
The operating segments information for 2013, 2012 and 2011 is as follows:
Year ended December 31, 2013
(in millions of €)
United States
Belgium(2)
SEE(3)
Corporate
Total
Revenues(1)
12 889
5 071
3 148
—
21 108
Cost of sales
(9 554)
(4 045)
(2 405)
—
(16 004)
Gross profit
3 335
1 026
743
—
5 104
Gross margin
25.9%
20.2%
23.6%
—
24.2%
Other operating income
57
44
28
—
129
Selling, general and administrative expenses
(2 915)
(866)
(647)
(48)
(4 476)
Other operating expenses
(45)
(17)
(209)
1
(270)
Operating profit (loss)
432
187
(85)
(47)
487
Operating margin
3.4%
3.7%
(2.7%)
—
2.3%
Adjustments:
Impairment losses (reversals)
16
2
195
—
213
Reorganization expenses (reversals)
18
—
—
—
18
Store closing expenses (reversals)
6
—
2
—
8
(Gains) losses on disposal of assets
(1)
8
1
2
10
(Gains) losses on disposal of businesses
—
(9)
—
—
(9)
Other
10
10
1
5
26
Underlying operating profit (loss)
481
198
114
(40)
753
Underlying operating margin
3.7%
3.9%
3.6%
N/A
3.6%
Other information (incl. discontinued operations and assets held for sale)
Assets
6 984
1 867
2 106
639(5)
11 596
Liabilities
2 481
1 399
807
1 833
6 520
Capital expenditures
276
140
127
22
565
Non-cash operating activities :
Depreciation and amortization
391
115
83
10
599
Impairment losses(4)
22
3
206
—
231
Share-based compensation
13
1
—
2
16
Operating result of discontinued operations
(34)
—
(1)
—
(35)
92
DELHAIZE GROUP ANNUAL REPORT 2013
FINANCIAL STATEMENTS