Food Lion 2013 Annual Report Download - page 151
Download and view the complete annual report
Please find page 151 of the 2013 Food Lion annual report below. You can navigate through the pages in the report by either clicking on the pages listed below, or by using the keyword search tool below to find specific information within the annual report.-
 1
1 -
2
-
3
-
4
-
5
-
6
-
7
-
8
-
9
-
10
-
11
-
12
-
13
-
14
-
15
-
16
-
17
-
18
-
19
-
20
-
21
-
22
-
23
-
24
-
25
-
26
-
27
-
28
-
29
-
30
-
31
-
32
-
33
-
34
-
35
-
36
-
37
-
38
-
39
-
40
-
41
-
42
-
43
-
44
-
45
-
46
-
47
-
48
-
49
-
50
-
51
-
52
-
53
-
54
-
55
-
56
-
57
-
58
-
59
-
60
-
61
-
62
-
63
-
64
-
65
-
66
-
67
-
68
-
69
-
70
-
71
-
72
-
73
-
74
-
75
-
76
-
77
-
78
-
79
-
80
-
81
-
82
-
83
-
84
-
85
-
86
-
87
-
88
-
89
-
90
-
91
-
92
-
93
-
94
-
95
-
96
-
97
-
98
-
99
-
100
-
101
-
102
-
103
-
104
-
105
-
106
-
107
-
108
-
109
-
110
-
111
-
112
-
113
-
114
-
115
-
116
-
117
-
118
-
119
-
120
-
121
-
122
-
123
-
124
-
125
-
126
-
127
-
128
-
129
-
130
-
131
-
132
-
133
-
134
-
135
-
136
-
137
-
138
-
139
-
140
-
 141
141 -
 142
142 -
 143
143 -
 144
144 -
 145
145 -
 146
146 -
 147
147 -
 148
148 -
 149
149 -
 150
150 -
 151
151 -
 152
152 -
 153
153 -
 154
154 -
 155
155 -
 156
156 -
 157
157 -
 158
158 -
 159
159 -
 160
160 -
 161
161 -
162
-
163
-
164
-
165
-
166
-
167
-
168
-
169
-
170
-
171
-
172
-
173
-
174
-
175
-
176
 |
 |

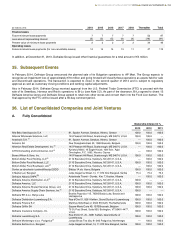
OCI to profit or loss in 2012 following the tender of the senior notes in December 2012 (see Note 18.1) and the termination of
hedge accounting.
In 2013, other finance costs mainly contain commitment fees for credit lines. In 2012, this caption included €17 million net debt
refinancing transactions costs (see Note 18.1) consisting of (i) net loss on debt repurchases of €14 million (€36 million of agreed
early repayment premiums and partly offset by fair value gains of €22 million on the related notes), and (ii) settlement of the
underlying cross-currency interest swaps (€3 million).
Borrowing costs attributable to the construction or production of qualifying assets were capitalized using an average interest rate
of 5.5%, 5.6% and 6.2% in 2013, 2012 and 2011, respectively.
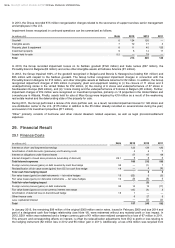
29.2 Income from Investments
(in millions of €)
Note
2013
2012
2011
Interest and dividend income from bank deposits and securities
9
5
9
Gains on disposal of securities
—
6
8
Foreign currency gains on financial assets
30
—
3
7
Fair value gains (losses) on currency swaps and foreign exchange forward contracts
—
—
(2)
Other investing income
—
2
1
Total
9
16
23
No impairment losses on financial assets were incurred during 2013, 2012 and 2011.
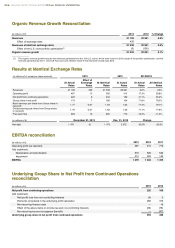
30. Net Foreign Exchange Losses (Gains)
The exchange differences charged (credited) to the income statement, excluding the impact of hedge accounting and economic
hedges, were as follows:
(in millions of €)
Note
2013
2012
2011
Cost of sales
—
1
—
Selling, general and administrative expenses
—
(2)
1
Finance costs
29.1
14
12
(10)
Income from investments
29.2
—
(3)
(7)
Total
14
8
(16)
31. Earnings Per Share (“EPS”)
Basic earnings per share is calculated by dividing the profit attributable to equity holders of the Group by the weighted average
number of ordinary shares outstanding during the year, excluding ordinary shares bought by the Group and held as treasury
shares (see Note 16).
Diluted earnings per share is calculated by adjusting the weighted average number of ordinary shares outstanding to assume
conversion of all potential dilutive ordinary shares. The Group only has dilutive potential share-based awards (see Note 21.3).
Dilutive share-based awards are assumed to have been exercised, and the assumed proceeds from these instruments are
regarded as having been received from the issue of ordinary shares at the average market price of ordinary shares during the
period. The difference between the number of ordinary shares issued and the number of ordinary shares that would have been
issued at the average market price of ordinary shares during the period is treated as an issue of ordinary shares for no
consideration.
Approximately 3 982 153, 4 581 153 and 2 651 448 shares attributable to the exercise of outstanding stock options and warrants
were excluded from the calculation of diluted earnings per share for 2013, 2012 and 2011, respectively, as their effect was anti-
dilutive because their average exercise price was higher than the average market price during the year.
DELHAIZE GROUP ANNUAL REPORT 2013 FINANCIAL STATEMENTS
149