Food Lion 2013 Annual Report Download - page 74
Download and view the complete annual report
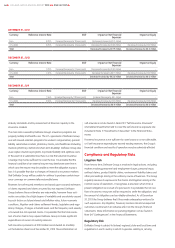
Please find page 74 of the 2013 Food Lion annual report below. You can navigate through the pages in the report by either clicking on the pages listed below, or by using the keyword search tool below to find specific information within the annual report.-
 1
1 -
2
-
3
-
4
-
5
-
6
-
7
-
8
-
9
-
10
-
11
-
12
-
13
-
14
-
15
-
16
-
17
-
18
-
19
-
20
-
21
-
22
-
23
-
24
-
25
-
26
-
27
-
28
-
29
-
30
-
31
-
32
-
33
-
34
-
35
-
36
-
37
-
38
-
39
-
40
-
41
-
42
-
43
-
44
-
45
-
46
-
47
-
48
-
49
-
50
-
51
-
52
-
53
-
54
-
55
-
56
-
57
-
58
-
59
-
60
-
61
-
62
-
63
-
 64
64 -
 65
65 -
 66
66 -
 67
67 -
 68
68 -
 69
69 -
 70
70 -
 71
71 -
 72
72 -
 73
73 -
 74
74 -
 75
75 -
 76
76 -
 77
77 -
 78
78 -
 79
79 -
 80
80 -
 81
81 -
 82
82 -
 83
83 -
 84
84 -
85
-
86
-
87
-
88
-
89
-
90
-
91
-
92
-
93
-
94
-
95
-
96
-
97
-
98
-
99
-
100
-
101
-
102
-
103
-
104
-
105
-
106
-
107
-
108
-
109
-
110
-
111
-
112
-
113
-
114
-
115
-
116
-
117
-
118
-
119
-
120
-
121
-
122
-
123
-
124
-
125
-
126
-
127
-
128
-
129
-
130
-
131
-
132
-
133
-
134
-
135
-
136
-
137
-
138
-
139
-
140
-
141
-
142
-
143
-
144
-
145
-
146
-
147
-
148
-
149
-
150
-
151
-
152
-
153
-
154
-
155
-
156
-
157
-
158
-
159
-
160
-
161
-
162
-
163
-
164
-
165
-
166
-
167
-
168
-
169
-
170
-
171
-
172
-
173
-
174
-
175
-
176
 |
 |
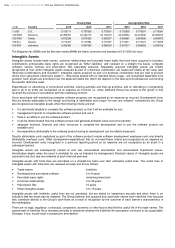
Consolidated Income Statement
e 2013 1) 1)
21 108 20 991 19 519
25 16 004) 15 891) 14 586)
5 104 5 100 4 933
2% 3% 3%
27 129 116 112
24 ) 4 425) 4 098)
28 ) (376) (172)
87 415 775
3% 0% 0%
1 (197) (246) (192)
2 9 16 23
36 4 4 4
03 189 610
22 ) (29) )
26 160 465
3 (43) (58) 7
3 102 472
4 (2)
79 104 472
31
20 61 62
77 03 69
19 60 59
76 03 65
101 029 100 777 100 684
101 570 101 134 101 426
(in millions of €)
Note
2013
2012(1)
2011(1)
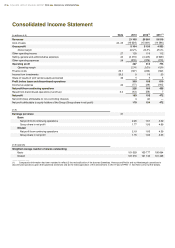
Revenues
21 108
20 991
19 519
Cost of sales
24, 25
(16 004)
(15 891)
(14 586)
Gross profit
5 104
5 100
4 933
Gross margin
24.2%
24.3%
25.3%
Other operating income
27
129
116
112
Selling, general and administrative expenses
24
(4 476)
(4 425)
(4 098)
Other operating expenses
28
(270)
(376)
(172)
Operating profit
487
415
775
Operating margin
2.3%
2.0%
4.0%
Finance costs
29.1
(197)
(246)
(192)
Income from investments
29.2
9
16
23
Share of results of joint venture equity accounted
36
4
4
4
Profit before taxes and discontinued operations
303
189
610
Income tax expense
22
(77)
(29)
(145)
Net profit from continuing operations
226
160
465
Result from discontinued operations (net of tax)
5.3
(43)
(58)
7
Net profit
183
102
472
Net profit (loss) attributable to non-controlling interests
4
(2)
—
Net profit attributable to equity holders of the Group (Group share in net profit)
179
104
472
(in €)
Earnings per share
31
Basic
Net profit from continuing operations
2.20
1.61
4.62
Group share in net profit
1.77
1.03
4.69
Diluted
Net profit from continuing operations
2.19
1.60
4.59
Group share in net profit
1.76
1.03
4.65
(in thousands)
Weighted average number of shares outstanding
Basic
101 029
100 777
100 684
Diluted
101 570
101 134
101 426
_______________
(1) Comparative information has been restated to reflect (i) the reclassification of the banners Sweetbay, Harveys and Reid’s and our Montenegrin operations to
discontinued operations given their (planned) divestiture and (ii) the initial application of the amendments to IAS 19 and of IFRS 11. See Note 2.2 for further details.
72
DELHAIZE GROUP ANNUAL REPORT 2013
FINANCIAL STATEMENTS